 CHARACTERISTICS OF PARTICIPATION
TYPE OF PARTICIPATION
People can choose to take part in sport and physical recreation either through organised or non-organised activities. Organised activities can be arranged through recreation clubs, sporting or non-sporting associations, or a wide variety of other sporting and non-sporting arrangements. Around a quarter of the population (26%) reported participating in organised sport and physical recreation while double that percentage (52%) took part in non-organised activity.
Participation in organised sport and physical recreation was highest amongst persons aged 15-17 years (58%). A decline in participation in organised activity was evident as age increased, however, this trend ceased to be statistically significant after ages 55-64 years. A larger percentage of males participated in organised activity than females (28% and 24% respectively), whereas participation in non-organised activity was the same for both males and females (52%) (Table 3).
FREQUENCY OF PARTICIPATION
Of the 11.1 million people who participated in sport and physical recreation in the 12 months prior to interview, 51% participated 105 times or more (i.e. on average at least two times each week). By comparison, 9% participated 1-12 times in the 12 months prior to interview. A larger percentage of female than male participants took part 105 times or more (54% compared with 48% respectively). Comparing the top 25 sports, persons walking for exercise were more likely to participate 105 times or more (60%). This was followed by weight training, where 51% of participants participated 105 times or more (Tables 4 and 8).
FACILITIES USED
Overall, 58% of Australians who participated in sport and physical recreation used non-structured outdoor facilities such as parks, beaches or walking trails when undertaking their activity. This was the most frequently used facility. More structured facilities including gyms, public pools and courts (52%) were the next most commonly used. The popularity of these two types of facilities was found to be consistent for both males (56% and 52% respectively) and females (60% and 52% respectively) (Table 12).
The most popular facilities used for those participating in organised sports and physical recreational activities were structured facilities such as gyms, public pools or courts (73%), while facilities such as parks, beaches and walking trails were the most popular locations for those participating in non-organised activities (66%) (Table 13).
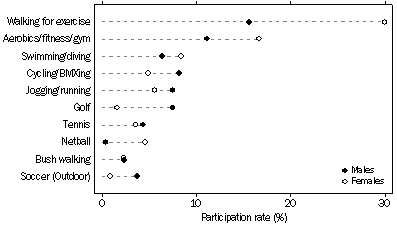
POPULAR SPORTS AND ACTIVITIES
Walking for exercise was the most popular physical recreational activity, with 23% of the population walking for exercise at least once in the 12 months prior to interview. The next most popular activity group was aerobics, fitness or gym activities (14%), followed by swimming or diving (7%). Females were twice as likely to walk for exercise than males (30% and 16% respectively). More females than males participated in both aerobics, fitness or gym activities (17% and 11% respectively) and swimming or diving (8% and 6% respectively). Participation rates for walking for exercise were highest for persons aged 55-64 years (34%), and were lowest for persons aged 15-17 years (6%). The aerobics, fitness or gym activities group was most popular for those aged 18-24 years and 25-34 years with about 1 in 5 participating (Tables 6 and 7).
Participation in most popular sports and physical recreational activities, By sex
 Quality Declaration
  Print Page
 Print All