FEATURE ARTICLE 1: ABORIGINAL AND TORRES STRAIT ISLANDER POPULATION ESTIMATES, 2011 - PRELIMINARY
INTRODUCTION
This publication presents preliminary estimates of Aboriginal and Torres Strait Islander, non-Indigenous and total populations of Australia, as at 30 June 2011. These estimates are disaggregated by age, sex, and where possible, state and territory, and can be found in Tables 11 and 12 of this publication. Final estimates will be released in August 2013 in Estimates of Aboriginal and Torres Strait Islander Australians (cat. no. 3238.0.55.001) with detailed commentary. A time series of data going back to 2001 will be released in the first half of 2014 in Estimates and Projections, Aboriginal and Torres Strait Islander Australians, 2001 to 2026 (cat. no. 3238.0).
The preliminary estimates released in this publication are based on the 2011 Census of Population and Housing counts of Aboriginal and Torres Strait Islander peoples, adjusted for net undercount as measured by the Post Enumeration Survey. Details of the estimation methodology are provided in Feature Article: Methodology used to produce Aboriginal and Torres Strait Islander Population Estimates (included in this publication).
POPULATION
The preliminary estimated resident Aboriginal and Torres Strait Islander population of Australia as at 30 June 2011 was 670,000 people, or 3.0% of the total Australian population.
NSW had the largest Aboriginal and Torres Strait Islander population (208,400 people), followed by Queensland (188,900 people) and Western Australia (88,300 people). These three states combined comprised 72.5% of the total Aboriginal and Torres Strait Islander population of Australia. The Australian Capital Territory had the smallest population of Aboriginal and Torres Strait Islander peoples (6,200 people).
PRELIMINARY POPULATION ESTIMATES, INDIGENOUS STATUS BY STATE AND TERRITORY - 30 JUNE 2011
PRELIMINARY POPULATION ESTIMATES, INDIGENOUS STATUS - 30 JUNE 2011 |
|
 | Aboriginal and Torres Strait Islander | Non-Indigenous | Total |
 | persons | persons | persons |
|
| New South Wales | 208 364 | 7 003 104 | 7 211 468 |
| Victoria | 47 327 | 5 487 199 | 5 534 526 |
| Queensland | 188 892 | 4 285 206 | 4 474 098 |
| South Australia | 37 392 | 1 600 840 | 1 638 232 |
| Western Australia | 88 277 | 2 263 938 | 2 352 215 |
| Tasmania | 24 155 | 487 040 | 511 195 |
| Northern Territory | 68 901 | 162 430 | 231 331 |
| Australian Capital Territory | 6 167 | 361 585 | 367 752 |
| Australia(a) | 669 736 | 21 654 197 | 22 323 933 |
|
| (a) Includes Other Territories |
Age and sex structure
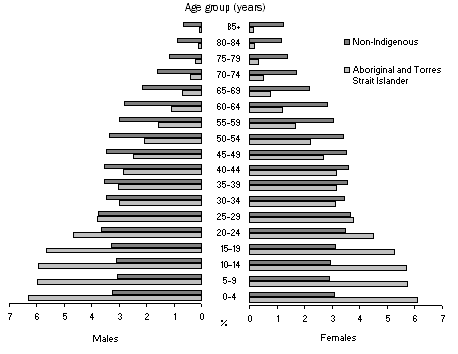
The preliminary Aboriginal and Torres Strait Islander population at 30 June 2011 had a younger age structure than the non-Indigenous population, with a larger proportion of young people and a smaller proportion of older people (see graph below). The much younger age structure of the Aboriginal and Torres Strait Islander population is largely a product of relatively high levels of fertility and mortality compared with the non-Indigenous population.
In 2011, the proportion of Aboriginal and Torres Strait Islander people under 15 years of age was 35.8%, compared with 18.3% of the non-Indigenous population in the same age group. Persons aged 65 years and over comprised 3.4% of the Aboriginal and Torres Strait Islander population and 14.1% of the non-Indigenous population. The age structures of the male and the female Aboriginal and Torres Strait Islander populations were similar.
Preliminary Aboriginal and Torres Strait Islander and non-Indigenous populations - 30 June 2011

 Print Page
 Print All
 Quality Declaration