Contents >>
Tourism, Culture and Recreation
TOURISM, CULTURE AND RECREATION
TOURIST ACCOMMODATION
The data presented here refer to hotels, motels, guest houses and serviced apartments with 15 or more rooms and units.
In the December quarter 2005, there were 58 hotels, motels, guest houses and serviced apartments within the Australian Capital Territory (ACT), up two establishments from the December quarter 2004. Of the 58 accommodation establishments offering in 2005, 15 were licensed hotels, 26 were motels and guest houses, and 17 were serviced apartments. A total of 2,379 people were employed by these establishments.
Occupancy
Accommodation establishments in the ACT had a room occupancy rate of 69% in the year ended December 2005, which was comparable to the rate in 2004 (67%). Nationally, the room occupancy rate in the year ended December 2005 was 63%.
Average length of stay
In the year ended December 2005, guests in hotels, motels, guest houses and serviced apartments in the ACT stayed 2.4 days on average, comparable with the 2.2 days on average recorded in 2004. Nationally, the average length of stay in the year ended December 2005 was 2.3 days.
Average lengths of stay for each type of accommodation establishment in the ACT in the December quarter 2005 were:
- serviced apartments - 3.4 days;
- licensed hotels - 2.3 days; and
- motels and guest houses - 2.3 days.
Room nights occupied
The number of room nights occupied in the ACT in the year ended December 2005 was 1.3 million nights, which was higher than the number of room nights occupied in 2004 (1.2 million nights).
Takings
In the ACT, takings from total hotels, motels, guest houses and serviced apartments was $152.4m in the year ended December 2005, up 8% from 2004 ($140.7m).
Nationally, accommodation takings in the year ended December 2005 was $6,189.5m, an increase of 9% from 2004 ($5,674.8m).
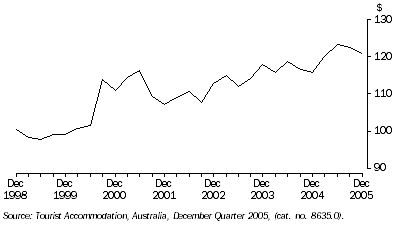
Average takings per room night occupied
The average takings per room night occupied in the ACT for the December quarter 2005 was $120.80, up 4% from the December quarter 2004 ($115.70).
13.1 AVERAGE TAKINGS PER ROOM NIGHT OCCUPIED, ACT
CULTURAL FUNDING
Cultural funding consists of money for heritage and the arts. Across all states and territories, funding for heritage activities was greater than that for arts activities. In 2003-04, heritage activities received $1,951.4m (or 83% of total funding), while arts activities received $404.8m (17%). Nationally, nature parks and reserves were the highest funded area with 42% of total cultural funding.
Libraries ($14.1m) and nature parks and reserves ($13.4m) were the highest funded heritage facilities in the ACT in 2003-04. Administration of culture ($2.7m) and performing arts venues ($2.7m) were the highest funded arts categories.
13.2 STATE AND TERRITORY GOVERNMENT CULTURAL FUNDING(a), By state and territory - 2003-04 |
|  |
| | | NSW | Vic. | Qld | SA | WA | Tas. | NT | ACT | Aust. | |
| | | $m | $m | $m | $m | $m | $m | $m | $m | $m | |
| |
| Heritage | | | | | | | | | | |
| Art museums | 50.0 | 54.2 | 26.3 | 6.3 | 10.9 | 0.4 | 7.3 | 4.4 | 159.9 | |
| Other museums | 150.3 | 71.9 | 23.7 | 15.4 | 38.4 | 10.7 | 12.6 | 1.8 | 324.8 | |
| Nature parks and reserves | 338.4 | 131.8 | 258.3 | 60.9 | 97.6 | 27.7 | 54.9 | 13.4 | 983.0 | |
| Zoological parks, aquaria and botanic gardens | | | | | | | | | | |
| | Zoological parks and aquaria | 24.8 | 13.7 | - | 3.9 | 8.6 | - | - | - | 50.9 | |
| | Botanic gardens | 35.9 | 10.8 | - | 9.6 | 14.5 | 2.4 | 2.5 | - | 75.7 | |
| Total | 60.6 | 24.5 | - | 13.5 | 23.1 | 2.4 | 2.5 | - | 126.6 | |
| Libraries and Archives | | | | | | | | | | |
| Libraries | 87.3 | 73.1 | 49.4 | 32.0 | 29.9 | 16.4 | 10.3 | 14.1 | 312.4 | |
| Archives | 16.3 | 7.1 | 5.8 | 9.2 | 1.7 | 1.6 | 2.9 | 0.2 | 44.7 | |
| Total | 103.6 | 80.2 | 55.2 | 41.2 | 31.6 | 18.0 | 13.1 | 14.3 | 357.1 | |
| Total heritage | 703.0 | 362.6 | 363.6 | 137.2 | 201.6 | 59.1 | 90.5 | 34.0 | 1 951.4 | |
| Arts | | | | | | | | | | |
| Literature and print media | 1.1 | 0.7 | 0.5 | 0.6 | 1.0 | 0.2 | 0.1 | 0.2 | 4.5 | |
| Performing arts | | | | | | | | | | |
| | Music | 7.7 | 4.5 | 1.3 | 3.9 | 4.0 | 0.9 | 0.5 | 1.9 | 24.6 | |
| | Drama | 7.8 | 3.1 | 5.1 | 4.3 | 2.9 | 0.4 | 0.3 | 0.7 | 24.6 | |
| | Dance | 2.2 | 1.7 | 2.5 | 1.4 | 2.4 | 0.3 | 0.2 | 0.4 | 11.2 | |
| | Music theatre and opera | 6.1 | 0.8 | 4.0 | 1.8 | 1.3 | 0.1 | - | 0.1 | 14.2 | |
| Other performing arts | 0.8 | 0.8 | 0.7 | 2.3 | 0.1 | 0.1 | 0.4 | - | 5.2 | |
| Total | 24.6 | 10.8 | 13.6 | 13.7 | 10.7 | 1.9 | 1.3 | 3.1 | 79.8 | |
| Performing arts venues | 89.1 | 15.2 | 8.8 | 8.3 | 15.2 | 0.1 | 5.2 | 2.7 | 144.5 | |
| Visual arts and crafts | 3.8 | 3.8 | 2.3 | 1.9 | 1.9 | 0.4 | 0.8 | 1.8 | 16.7 | |
| Broadcasting and film | | | | | | | | | | |
| Radio and television services | - | - | - | 0.1 | 0.1 | - | - | 0.1 | 0.3 | |
| Film and video | 10.1 | 28.7 | 9.7 | 5.5 | 7.6 | 0.2 | 0.1 | 0.2 | 61.9 | |
| Multimedia | 0.1 | 0.1 | 0.1 | - | 0.3 | - | - | 0.1 | 0.7 | |
| Total | 10.2 | 28.8 | 9.7 | 5.6 | 8.0 | 0.2 | 0.1 | 0.3 | 63.0 | |
| Community cultural centres and activities | 2.1 | 2.3 | 2.1 | 0.5 | 4.3 | 0.1 | 0.6 | 0.7 | 12.7 | |
| Administration of culture | 8.4 | 6.5 | 5.2 | 2.3 | 14.7 | 1.4 | - | 2.7 | 41.2 | |
| Other arts n.e.c. | | | | | | | | | | |
| Arts education | - | 0.2 | - | 0.1 | 0.1 | - | - | - | 0.5 | |
| Major multi-arts festivals | 7.4 | 6.7 | - | 4.0 | 4.5 | 0.8 | 0.4 | - | 23.9 | |
| Other arts n.e.c. | 8.3 | 2.4 | 0.2 | 7.0 | 0.3 | - | - | - | 18.2 | |
| Total | 15.7 | 9.3 | 0.2 | 11.1 | 4.9 | 0.8 | 0.4 | - | 42.5 | |
| Total arts | 154.9 | 77.4 | 42.4 | 44.0 | 60.7 | 5.2 | 8.6 | 11.5 | 404.8 | |
| Total | 857.8 | 440.0 | 406.0 | 181.2 | 262.3 | 64.3 | 99.1 | 45.5 | 2 356.2 | |
| |
| - nil or rounded to zero (including null cells) |
| (a) Care should be taken when comparing categories between states and territories for some categories of funding as the funding provided by state and territory governments may vary according to the administrative arrangements existing in the respective states and territories. |
| Source: Cultural Funding by Government, Australia, 2003-04, (cat. no. 4183.0). |
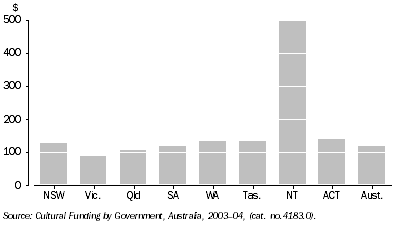
State and territory funding per person
In 2003-04, the national level of cultural funding per person by state and territory governments was $118. This level was exceeded in the ACT where the territory government provided funding of $141 per person - surpassed only by the Northern Territory (NT) Government with relatively large funding of $498 per person. The lowest level of cultural funding by a state or territory government was provided by the Victorian Government with $89 per person.
13.3 CULTURAL FUNDING PER PERSON, By state and territory governments - 2003-04
INVOLVEMENT
Involvement in organised sport and physical activity
Involvement in organised sport and physical activity includes playing and participating, as well as being involved in non-playing roles such as coach, referee or committee member. However, persons whose only involvement is as a spectator or club member are excluded.
In April 2004, the participation rate of persons with involvement (either playing or non-playing) in the ACT is 32%. This proportion is commensurate with the NT (32%) as the highest of the states and territories, and is higher than the national participation rate (27%).
13.4 PERSONS INVOLVED IN ORGANISED SPORT OR PHYSICAL ACTIVITY(a), By state and territory
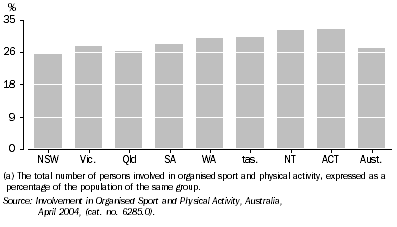
The participation rate of ACT persons involved in actually playing organised sport was 28%. This is comparable with the NT (30%) and above the national figure of 23%. In the ACT, of those persons surveyed who had non-playing involvement, the participation rate was highest as a Coach, Instructor or Teacher (6%), followed by Committee member or Administrator (5%).
FLORIADE
Floriade is the ACT's annual festival of flowers. This event is complimented by a variety of entertainment and community activities throughout Canberra. The festival runs for approximately one month from mid-September to mid-October each year, and the floral displays are in Commonwealth Park.
Data was collected by the Australian Capital Tourism Corporation through spectator surveys at the event.
In 2005 the festival ran from 17 September to 16 October, the theme was Rock 'n' roll in bloom, and the 12 showcase gardens displays comprised 1.47 million blooms. The displays covered over four hectares.
The community's involvement increased from previous years with over 220 people donating their time and services to the event. This equated to over 5,400 hours. A record 55 community groups performed at this year's Floriade.
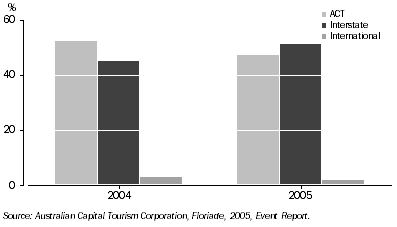
Total attendance for Floriade 2005 was 356,676 people, a 5% increase from total visitors in 2004. Forty-seven percent of these were from the ACT, 51% were interstate visitors and 2% were international visitors to the region. Overall there was a 27% increase in interstate and international attendees compared to last year's event. Of the interstate visitors 62% stayed overnight and 38% visited Floriade on a day trip.
13.5 ORIGIN OF FLORIADE ATTENDEES - 2004 and 2005
For the thirty day event, the ACT Government estimated that Floriade visitors spent approximately $20.6m in the ACT. Accommodation (47%) and meals/food and drink (21%) were the highest areas of expenditure for visitors.
13.6 FLORIADE 2005, Estimated Expenditure by Visitors |
| |
| Total Expenditure | Total Expenditure | |
| ($000) | % | |
| |
| Accommodation | 9 666 | 47 | |
| Meals/food and drinks | 4 235 | 21 | |
| Transport within the ACT | 1 411 | 7 | |
| Plants/garden equipment/merchandise | 1 134 | 5 | |
| Other expenses | 4 104 | 20 | |
| Total expenditure by visitors | 20 550 | 100 | |
| |
| Source: Australian Capital Tourism Corporation, Floriade, 2005 Event Report. |
RALLY OF CANBERRA
The 2005 Rally of Canberra was the opening round of the FIA Asia Pacific Rally Championship, and was held on 23 and 24 April 2005. The event attracted 48 teams, comprising 10 international, 30 interstate and 8 ACT based teams. The rally was conducted over various closed public forest roads in and around Canberra.
Data was collected through spectator surveys and ticket sales for the event by the Australian Capital Tourism Corporation.
13.7 RALLY OF CANBERRA, Attendance by spectator origin - 2005
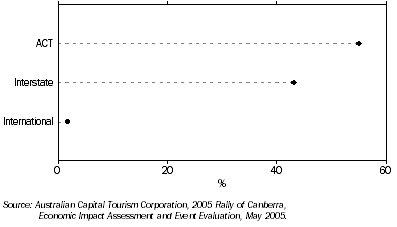
Of the 2,187 interstate visitors, 67% stayed one night or more in the ACT, while 33% were day-trippers. Of all attendees to the rally 73% were male and 27% female, with 31% of spectators in the 20-29 year age bracket. Twenty nine per cent were in the 30-39 year age bracket, while 19% were 40-49 years.
The ACT Government estimated that visitors who attended the rally spent $964,000 in the ACT. This figure included competitors, support staff and media. The length of stay varied depending on purpose of stay. Interstate spectators and the media averaged a two night stay, while competitors and support staff averaged a six night stay.
Accommodation (40%) and meals/food and drinks (25%) were the highest areas of expenditure for visitors staying in the ACT one night or more.
13.8 RALLY OF CANBERRA 2005, Estimated expenditure by visitors |
| |
| Total Expenditure | Total Expenditure | |
| ($) | % | |
| |
| Accommodation | 70 101 | 40 | |
| Meals/food and drinks | 43 310 | 25 | |
| Tickets for event | 21 554 | 12 | |
| Transport within the ACT | 19 576 | 11 | |
| Rally merchandise | 9 525 | 5 | |
| Other expenses | 12 756 | 7 | |
| Total expenditure by overnight visitors | 176 882 | 100 | |
| |
| Source: Australian Capital Tourism Corporation, 2005 Rally of Canberra, Economic Impact Assessment and Event Evaluation, May 2005. |
Day trippers spent an estimated $12,680 in the ACT. The majority of this expenditure related to meal/food and drinks at the event (31%) and tickets for the event (30%).
SUMMERNATS
The Summernats festival is a four day car show and exhibition event held in January of each year in the ACT. Data were collected through spectator surveys and ticket sales for the event by Street Machine Services.
The first event was held at Exhibition Park in Canberra in 1988, with approximately 47,000 spectators and over 900 vehicle entrants. Attendance at the event has fluctuated over the last seven years. In 2006, the festival attracted almost 98,000 spectators and 1,500 entrants.
13.9 SUMMERNATS ATTENDANCE IN THE ACT |
| |
| 2000 | 2001 | 2002 | 2003 | 2004 | 2005 | 2006 | |
| |
| Spectators | 112 486 | 113 527 | 93 702 | 107 471 | 116 056 | 118 921 | 97 798 | |
| Entrants | 1 700 | 1 700 | 1 400 | 1 430 | 1 589 | 1 483 | 1 473 | |
| |
| Source: Summernats Car Festival Office, 2006, Data available on request. |
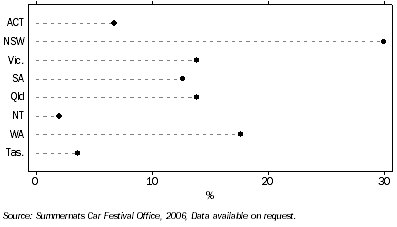
The highest proportion of interstate spectators to the festival in 2006 were New South Wales (NSW) residents, making up 30% of total spectators. This was followed by Western Australia (18%), Victoria and Queensland (14% respectively).
13.10 SUMMERNATS SPECTATORS, By state or territory of residence - 2006
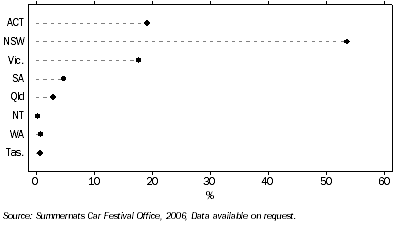
he highest proportion of total entrants in 2006 were from NSW (54%). This was followed by the ACT (19%), and Victoria (18%).
13.11 SUMMERNATS ENTRANTS, By state or territory - 2006
According to the organisers, approximately half of all visitors to Summernats stayed in Canberra for three to four days. Of those visitors, each was estimated to have spent, on average, $280 on accommodation, food, entertainment and travel per day. It was estimated by the event organisers that Summernats' patrons spent between $10m and $12m in total while staying in the ACT.
Summernats incorporates a trade show within the festival, which had approximately 256 commercial exhibitors in 2006. The majority of items sold by exhibitors were car parts, clothing and apparel, collectibles, food, event merchandise and vehicle stickers.
BIBLIOGRAPHY
ABS
Cultural Funding by Government, Australia, 2003-04, cat. no. 4183.0.
Involvement in Organised Sport and Physical Activity, Australia, April 2004, cat. no. 6285.0.
Tourist Accommodation, Australia, December 2005, cat. no. 8635.0, Time Series Spreadsheets.
NON-ABS
Australian Capital Tourism Corporation, Floriade, 2005 Event Report, last viewed 11 August 2006, <http://www.tams.act.gov.au/play/tourism>.
Australian Capital Tourism Corporation, 2005 Rally of Canberra, Economic Impact Assessment and Event Evaluation, May 2005, last viewed 11 August 2006, <http://www.tams.act.gov.au/play/tourism>.
Summernats Car Festival Office, 2006, Data available on request.
 Print Page
 Print All