Education News - November, 2008
This newsletter highlights the latest curriculum related teaching resources, student activities and statistical tools that have been developed by ABS Education Services as well as other ABS resources that are useful for schools.
Contents
- CensusAtSchool 2008 Update
- An Idea for the Classroom
- The 2nd CensusAtSchool International Workshop
- Free Teacher Librarian Information Sessions
- The arrival of 2006 CDATA Online
- What's new on the ABS home page?
- Snapshot of results from the Adults Life and Literacy Skills (ALLS) survey
- Conference Participation
- Recently Released Publications
- Contact details
1. CensusAtSchool 2008 Update
 Random samples in excess of 22,000!
As we enter the fourth month of the Data Usage Phase, over 22,000 random samples have been generated from the CensusAtSchool Random Sampler.
If your students enjoyed completing the questionnaire, they will be even more excited to analyse the data that they are a part of. Even if your students are not part of the data, they will still enjoy learning about Australian students like themselves. Use the Random Sampler to draw a sample of up to 200 students, tailor your sample to retrieve data from your state/year level/school size. If you have trouble generating a sample, it may be because your criteria is too specific, and not enough data was collected to meet your sample characteristics (due to a 10% confidentiality rule, there must be at least 2000 student records for every 200 sample with certain characteristics). If you receive this response, it is a good idea to reduce the number of characteristics you have selected (i.e. make your sample more general). Visit the CensusAtSchool Data page for access to the Random Sampler, Information Tables and Prepared Samples - a wealth of real data is ready-to-go for investigation in the classroom.
Professional Development workshops in Victoria
The first of two Victorian CensusAtSchool Professional Development workshops was held on 15 October, at the Australian Bureau of Statistics in Melbourne. ABS Teacher Consultant, Pat Beeson, conducted a hands-on session using MS Excel. Participants had an opportunity to have a go at the Questionnaire, explore the range of materials available on CensusAtSchool website, observe the final 2008 Results and create their own graphs/tables/calculations using the 2008 data. The workshops focus on formatting and presentation of data, in addition to calculations in Excel.
The next FREE Victorian workshop is scheduled for Thursday 13 November at the ABS at 485 Latrobe Street, Melbourne. The session will cater for Primary and Secondary Math & SOSE classroom use of CensusAtSchool data. For more information, check the Professional Development Timetable. If you are interested in attending, please send an email to censusatschool@abs.gov.au.
FREE workshops are offered throughout Australia on a yearly basis, introducing teachers to CensusAtSchool using Microsoft Excel. What teachers get out of the workshop is not only increased knowledge about the project, but more confidence to use Excel in the classroom. Whether you're a novice or regular user, you are bound to learn something new. If you can't make it to our workshops the CensusAtSchool PD tutorials are the next best thing!
Updated Activities now available
All CensusAtSchool activities have now been revised using 2008 data, to meet the needs of a range of teaching and learning situations. The activities are linked to state and territory curricula, and are categorised into SOSE, Maths and Introductory Excel. The latter are provided to assist students and teachers with basic Microsoft Excel skills required to use the CensusAtSchool data. Each activity includes:
- Print friendly Activity Sheet/Student Worksheet
- Simplified data sample - these are prepared random samples in an Excel worksheet, for use when the internet is problematic
- Table of data - datasets in Word format, useful when students don't have access to computers.
'Who Has Broadband? ' a new activity designed for National Mathematics Day and previously on the AAMT website, has been added to the list.
Students conduct a time series investigation on how internet access has changed over time, using the 2006 and 2008 CensusAtSchool databases as their data source.
| How to get involved: Generate a Random Sample from the Student Area of the website. Please contact the CensusAtSchool Team if you have a query or if you would like to provide some feedback. We'd love to hear from you. |
2. An Idea for the Classroom
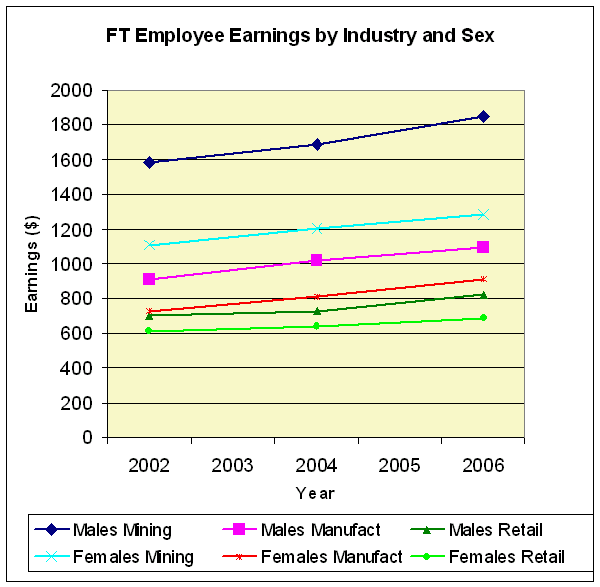
One of the new Economic Datasets shows average full time employee earnings for different industries by sex for three separate years (2002, 2004 and 2006). This can be a useful source of data for students in many curriculum areas examining the Australian workforce.
It can lead to interesting and challenging discussions around why these differences are seen. What can explain the fact that female earnings are below male earnings in all industries? Why are earnings higher in the mining industry? Is industry a more important factor in determining earnings than gender? In which industries has the increase in full time employee earnings been greatest over the years 2002 to 2006?
The graph below shows the differences between male and female full time earnings for three industries (mining, manufacturing and retail).
 |
The Dataset contains information for 16 industry categories (mining, manufacturing, electricity, gas and water supply, construction, wholesale trade, retail trade, accommodation, cafes and restaurants, transport and storage, communication services, finance and insurance, property and business services, government administration and defence, education, health and community services, cultural and recreational services and personal and other services) as well as all industries combined.
Do you have a classroom idea that uses ABS data or ABS Education products? Let us know at education@abs.gov.au and we can share it with schools around Australia.
3. The 2nd CensusAtSchool International Workshop
Following the successful inaugural CensusAtSchool International Workshop held at the Australian Bureau of Statistics in Melbourne last year, the time had come to regroup and progress CensusAtSchool along the path of becoming a truly international project. This second international workshop took place on 28-31 July 2008 at the University of California, Los Angeles (UCLA) and was hosted by the Department of Statistics.
Some of the key aims of the workshop were to:
· Clarify what the international and national questions in the C@S questionnaire are
· Continue the planning of a policy for unifying the international databases and output
· Determine how new countries that cannot afford to run the projects will participate.

Left to right: a South African representative, Paul W. Taylor (Australian Bureau of Statistics) and Martha Aliaga (American Statistical Association)
The first two days of the workshop included a wide range of of information-sharing presentations covering: statistical literacy strategies; practical classroom activities; comparisons of statistical literacy of different countries based around the PISA and ALLS surveys; and demonstrations of various technologies useful for statistical education.
The final days of the workshop were spent evaluating the progress made since the first workshop in 2007, and discussing the way forward for CensusAtSchool. The workshop provided participants with an opportunity to assess what it means to be part of International CensusAtSchool so that new countries know what to expect, and assess the role of CensusAtSchool against broader statistical literacy goals of countries. The conference enhanced the development of relationships and fostered progress on standard international questions. Watch this space for further developments in the international arena.
4. Free Teacher Librarian Information Sessions
Teacher Librarian Information workshops have now been conducted across Australia and participants were again overwhelmingly enthusiastic about these sessions. Many were unaware of the wealth of information that is available freely on the ABS website and are now looking forward to assisting students and teachers in their schools to find the information and resources that they need.
If you would like further information contact Education Services (details below). |
5. The arrival of 2006 CDATA Online
 SOSE/HSIE teachers take note ... CDATA Online is here! A product developed jointly by the ABS and Space -Time Research, it provides users an exciting new way to access 2006 Census data by giving them more control over what they want to look at coupled with innovative technology. CDATA will allow you to create your own tables of Census data on a range of different topics including age, education, income, housing, ethnicity, religion and much more. Using CDATA Online, you can combine comprehensive information about your community, and Australian society from the 2006 Census, with powerful web mapping software. When using the product, you will be requested to select geographic area/s and a topic from the list , then select a table of interest. You can even manipulate this table further depending on its complexity, in addition to a range of other functions available to you. Please see the product description, CDATA Online (cat. no. 2064.0), page for further information. SOSE/HSIE teachers take note ... CDATA Online is here! A product developed jointly by the ABS and Space -Time Research, it provides users an exciting new way to access 2006 Census data by giving them more control over what they want to look at coupled with innovative technology. CDATA will allow you to create your own tables of Census data on a range of different topics including age, education, income, housing, ethnicity, religion and much more. Using CDATA Online, you can combine comprehensive information about your community, and Australian society from the 2006 Census, with powerful web mapping software. When using the product, you will be requested to select geographic area/s and a topic from the list , then select a table of interest. You can even manipulate this table further depending on its complexity, in addition to a range of other functions available to you. Please see the product description, CDATA Online (cat. no. 2064.0), page for further information.
6. What's new on the ABS home page?
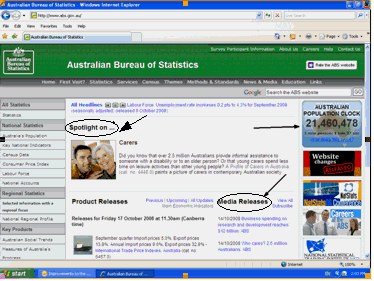 The ABS home page has been updated to help make it easier for users to quickly find what they are looking for. The highlights of the new look website include: The ABS home page has been updated to help make it easier for users to quickly find what they are looking for. The highlights of the new look website include:
Australian Population Clock: a daily projection of Australia's population growth based on the estimated resident population at 31March 2008. It assumes an overall total population increase of 1 person every 1 minute and 37 seconds. Read more about how the Population Clock works.
The 5 latest Media releases about recent publications have been linked to the home page. These are released by the ABS in conjunction with some publications and typically outline key findings from a survey. You can subscribe to receive these media releases directly to your email.
Main Economic Indicators link provides expected release dates for the leading economic indicators for six months, 1 October 2008 - 31 March 2009. This link is available under the 'Product Releases' section.
Spotlight on... section that focuses on a topical issue or recently released data. This will allow users to quickly find relevant information on the current topic. |
7. Snapshot of Results from the Adults Literacy and Life Skills Survey (cat no. 4228.0)
The Adult Literacy and Life Skills Survey (ALLS) was conducted in 2006 in Australia as part of an international study coordinated by Statistics Canada and the Organisation for Economic Co-operation and Development (OECD). It was designed to identify and measure literacy which can be linked to the social and economic characteristics of people both across and within countries. The first wave of countries included in the survey comprised the USA, Bermuda, Canada, Italy, Mexico, Norway and Switzerland. Australia participated in the second wave of enumeration with Hungary, the Netherlands, New Zealand and South Korea.
The ALLS provides information on knowledge and skills in four domains, namely: Prose Literacy, Document Literacy, Numeracy, and Problem Solving, with Level 1 being the lowest measure of literacy. Level 3 was regarded by the survey developers as the "minimum required for individuals to meet the complex demands of everyday life and work in the emerging knowledge-based economy" (www.statcan.ca).
A snapshot of results from the Numeracy and Problem Solving skills showed that:
- On the numeracy scale, approximately 53% Australians were assessed at Level 1 or 2, 31% at Level 3 and only 16% at Level 4/5.
- On the problem solving scale, approximately 70% Australians were assessed at Level 1 or 2, 25% at Level 3 and only 5% at Level 4/5.
Other interesting results showed a relationship between the median personal gross weekly income and Prose skill level. For example, the median weekly income for those who attained literacy scores at Level 3 on the prose scale was $695. For those who attained literacy scores at Level 4/5 on the prose scale, the median weekly income was $890. People who attained scores lower than Level 3 on the prose scale, had a median weekly income less than $504.
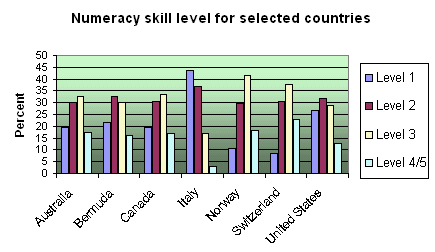
In the international context, Italy had the lowest proportion (3%) of respondents at Level 4/5 for Numeracy skills, and Switzerland had the highest (22.9%).
Two thirds of those who responded to the survey, agreed or strongly agreed that they 'received good grades in maths'. However, just over half of this group (56%) achieved a numeracy score at Level 3 or above. Similarly, 43% of males and 28% of females strongly agreed with the statement that they are good with numbers and calculations. Of these groups, 40% of females achieved numeracy scores at Level 1 or 2 while 29% of males achieved scores at Level 1 or 2.
You can find out more in Adult Literacy and Life Skills Survey, Summary Results, Australia, 2006 (cat. no. 4228.0)
8. Conference Participation |
Have you caught up with Education Services at a conference yet? Since the last newsletter staff have presented at a number of conferences around the country.
MANSW
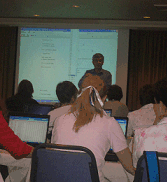 The 2008 MANSW Annual Conference took place on the 19-21 September at Novotel Northbeach, Wollongong and the participants were buzzing with excitement! CensusAtSchool was the topic of conversation at the ABS trade display where the CensusAtSchool team spoke with teachers about the investigative possibilities and educational benefits of the project. ABS Teacher Consultant, Ian Wong, hosted two workshops over the weekend including an introduction to CensusAtSchool, and a hands-on MS Excel session using CensusAtSchool data. The turnout at the workshops was fantastic, with 70 people attending in total.
SLAV
Sixty school teacher library technicians attended the 'A Wealth of ABS Data' session at the School Librarian Association of Victoria (SLAV) conference in October. Library technicians in schools are often called upon, by both teachers and students, to assist with accessing data, finding resources and suggesting useful web content.
AGTA
From GPS to GIS, geocaching, fieldwork, 3D modelling and Google, the exciting Australian Geography Teachers Association conference took place in conjunction with the Spatial Technology in Schools conference in Queensland in late September. Over 130 teachers attended workshops and fieldwork days. With 80% of data having a spatial component, the value of using spatial technologies was highlighted. The ABS held two workshops with a representative from the OESR. These workshops showed how to access the wide range of free demographic data on the ABS website and how to import it into GIS software. The ABS presentation is available on the AGTA website at http://www.agta.asn.au/. Participants found the wealth of information amazing and are now looking forward to the release of CDATA Online.
9. Recently Released Publications
Sports and the arts are significant both socially and economically and these three publications give a comprehensive overview of each, drawing together a wide range of relevant data:
Sports and Physical Recreation: A Statistical Overview, Australia (cat. no. 4156.0) An overview of sports and physical recreation in Australia. Topics covered include output of the sports and physical recreation sector, employment in sports and physical recreation, government outlays on recreation, international trade in sports and physical recreation goods, attendances at sporting events, and participation in sports and physical recreation activities.
Perspectives on Sport (cat.no.4156.0.55.001) This is the first issue of Perspectives on Sport, designed to provide users with articles that discuss issues relating to sport and sport programs. Articles are based on data collected from surveys such as the 2005-06 Multi-purpose Household Survey (MPHS) and Participation in Sports and Recreation, Australia, 2005-2006 (cat.no. 4177.0). Feature articles include What Motivates Australians to participate in Sport? Involvement in Organised Sport, and Sports and Physical Recreation Volunteers.
Arts and Culture in Australia: A Statistical Overview (cat. no. 4172.0). Includes information on a wide range of topics including employment in culture, time spent on cultural activities, attendances at cultural venues and events, expenditure on culture, and imports and exports of cultural goods and services. Also provides profiles of the cultural sectors, grouped according to the Australian Culture and Leisure Industry Classification.
Remember, all ABS publications are free to download from the ABS website.
 |
10. Contact details
 Print Page
 Print All