 POPULATION
Population change, Queensland
Regional population growth
POPULATION CHANGE, QUEENSLAND
The preliminary estimated resident population (ERP) for Queensland was 4,380,400 at 31 March 2009, an increase of 112,700 (2.6%) since 31 March 2008. Queensland accounted for 20% of the Australian population at 31 March 2009.
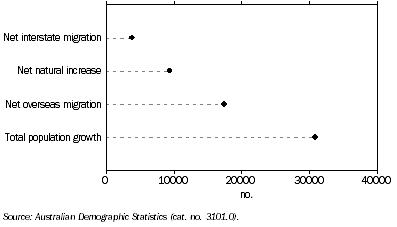
Between the December 2008 quarter and the March 2009 quarter, 57% (17,500 persons) of the total population increase of 30,900 persons was due to net overseas migration, 31% (9,400 persons) to natural increase (excess of births over deaths) and 13% (3,900 persons) was attributable to net interstate migration.
Population Change from Previous Quarter, Queensland - March 2009 quarter

Further information about Queensland's population can be accessed from
Australian Demographic Statistics (cat. no. 3101.0) or by contacting the National Information and Referral Service on 1300 135 070. This publication is released quarterly.
REGIONAL POPULATION GROWTH
At 30 June 2008, the Queensland population was estimated to be 4,293,900 persons. The south east corner comprising Brisbane, Gold Coast, Sunshine Coast and West Moreton Statistical Divisions accounted for two-thirds (66%) of the state's population.
Regional Population(a), By Statistical Division - At 30 June - 2001, 2006, 2007 and 2008 |
|
 |  | 2001 | 2006 | 2007 | 2008 |
 |  | '000 | '000 | '000 | '000 |
|
| Statistical division |  |  |  |  |
 | Brisbane | 1 663.1 | 1 857.8 | 1 902.2 | 1 945.6 |
 | Gold Coast | 387.1 | 466.4 | 484.6 | 497.8 |
 | Sunshine Coast | 247.2 | 295.1 | 304.1 | 312.8 |
 | West Moreton | 77.2 | 86.4 | 88.6 | 90.7 |
 | Wide Bay-Burnett | 232.0 | 264.1 | 271.3 | 278.0 |
 | Darling Downs | 209.0 | 225.8 | 228.8 | 231.6 |
 | South West | 27.0 | 26.4 | 26.2 | 26.2 |
 | Fitzroy | 186.5 | 206.2 | 210.9 | 214.8 |
 | Central West | 13.6 | 12.5 | 12.4 | 12.3 |
 | Mackay | 137.5 | 159.8 | 163.6 | 167.7 |
 | Northern | 190.3 | 209.9 | 215.4 | 220.7 |
 | Far North | 224.2 | 247.3 | 254.3 | 262.1 |
 | North West | 34.3 | 33.2 | 33.5 | 33.7 |
| Queensland | 3 628.9 | 4 090.9 | 4 196.0 | 4 293.9 |
|
| (a) Estimates as at 30 June are final for 2001, preliminary rebased for 2006 on results of the Census of Population and Housing, 2006, revised for 2007 and preliminary for 2008. For all years, Statistical divisions are based on the Australian Standard Geographical Classification 2008 Edition. |
| Source: Regional Population Growth, Australia (cat. no. 3218.0). |
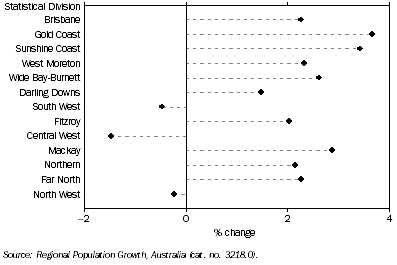
The fastest growing statistical divisions over the seven years between 30 June 2001 and 30 June 2008 were Gold Coast with an average annual growth rate of 3.7%, Sunshine Coast (3.4%) and Mackay (2.9%). Three statistical divisions recorded negative average annual growth during the same period: North West (-0.2%), South West (-0.5%) and Central West (-1.5%).
Regional Population, Average Annual Growth Rate, at 30 June
- 2001 to 2008

For more information on Queensland's regional population distribution, please refer to
Regional Population Growth, Australia (cat. no. 3218.0) or contact the National Information and Referral Service on 1300 135 070. This publication is released annually.
 Print Page
 Print All