Statistical Training
Improve Your Skills
CDATA Online
You can use CDATA Online to:
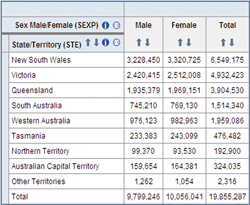
• Construct tables using 2006 Census Data
• Compare geographic areas
• Create custom geographic areas & data groups
• Add totals and view data as percentages
• Save your table to re-use later
• Export your table in Excel or CSV format
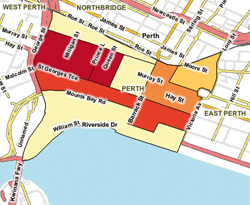
View your data as a Thematic Map
Once you have created a table, you can view the data as a map which can be customised in the following ways:
• Select the data to be mapped
• Zoom in and out on the map
• Customise your map colours and landmarks
• Download your map as a PDF or a PNG file
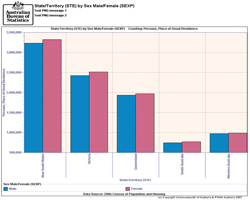
View your data in a variety of Graphs
Once you have created a table you can view the data as a graph which can be customised in the following ways:
• Choose from 7 different graph styles
• Select which data is included in your graph
• Download your graph as a PDF or a PNG file
If you are interested in learning how to use CDATA Online, please contact Marg Garner on (08) 9360 5127 to find out when the next FREE training course is being held!
 Print Page
 Print All