WATER RESOURCES
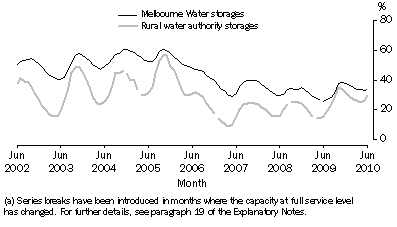
At the end of June 2010, Victoria's water storages were at 29.5% of their capacity at full service level of 14,020 GL. This was 3.1 percentage points higher than the level in May 2010, and 13.5 percentage points higher than in June 2009.
Melbourne's water storage level at the end of June 2010 was 33.8% of capacity. This was one percentage point higher than in May 2010 and 7.8 percentage points higher than in June 2009. Rural water storages held 29.5% of their capacity at the end of June 2010, 3.3 percentage points higher than in May 2010, and 13.9 percentage points higher than the level in June 2009.
Between June 2009 and June 2010, the volume of water held in rural water storages increased by 88.9%. Lake Eildon in the Goulburn basin captured 37.4% of this increase, with a further 40.1% of the increase being in Murray basin storages. Just under three-quarters (73.9%) of the storage capacity at full service level of Victoria's rural water storages (9,396 GL) is represented by Lake Eildon (3,390 GL) and the state's share of Murray basin storages (3,557 GL). From June 2009 to June 2010, the volume of water in Lake Eildon increased from 12.8% of capacity to 27.2%.
The total capacity of the state's storages reduced by 365 GL in April 2009 following the decommissioning of Lake Mokoan, while 38 GL was added to full capacity in June 2009 when the Tarago Reservoir was added to the Melbourne supply system. A summary of changes to total storage capacity since December 2004 can be found in paragraph 14 of the Explanatory Notes.
Water storage volumes, Per cent of capacity(a)
View underlying table as an Excel spreadsheet: Download Water storage levels, By River Basin from the
Downloads Page.
 Print Page
 Print All