(a) Seasonally adjusted numbers of new motor vehicle sales in Tasmania, Northern Territory and Australian Capital Territory should be used with caution. For more information, see paragraph 7 of the Explanatory Notes.
JULY KEY POINTS
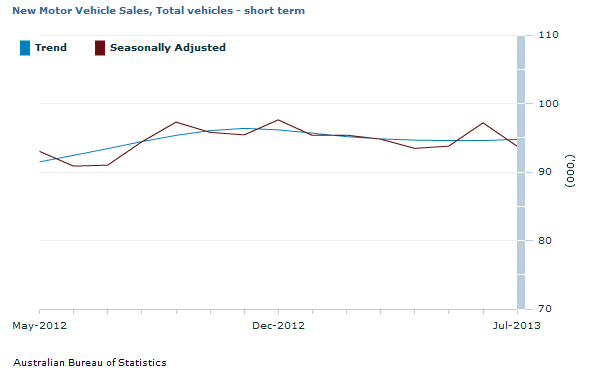
TOTAL NEW MOTOR VEHICLE SALES
Trend estimates: The July 2013 trend estimate (94 767) has increased by 0.2% when compared with June 2013.
Seasonally adjusted estimates: The July 2013 seasonally adjusted estimate (93 797) has decreased by 3.5% when compared with June 2013.
SALES BY TYPE OF VEHICLE
Trend estimates: When comparing national trend estimates for July 2013 with June 2013, sales of Sports utility and Other vehicles decreased by 0.1% and 0.2% respectively. Over the same period, Passenger vehicles increased by 0.5%.
Seasonally adjusted estimates: When comparing seasonally adjusted estimates for July 2013 with June 2013, sales of Passenger, Sports utility and Other vehicles decreased by 3.0%, 2.3% and 6.2% respectively.
SALES BY STATE
Trend estimates: Four of the eight states and territories experienced an increase for new motor vehicle sales when comparing July 2013 with June 2013. Tasmania recorded the largest percentage increase (1.5%), followed by the Northern Territory (1.1%) and then New South Wales (0.6%). Over the same period, sales in South Australia and Western Australia decreased by 0.7% and 0.6% respectively.
Seasonally adjusted estimates: Seven of the eight states and territories experienced a decrease in new motor vehicle sales when comparing July 2013 with June 2013. The Australian Capital Territory recorded the largest percentage decrease (6.7%), followed by Queensland (5.1%) and New South Wales (4.0%). Over the same period, sales in the Northern Territory increased by 8.6%.
NOTES
FORTHCOMING ISSUES
ISSUE
Release Date
August 2013
17 September 2013
September 2013
15 October 2013
October 2013
14 November 2013
November 2013
17 December 2013
December 2013
15 January 2014
January 2014
17 February 2014
ABOUT THIS ISSUE
This issue presents details for the Sales of New Motor Vehicles for July 2013.
INQUIRIES
For further information about these and related statistics, contact the National Information and Referral Service on 1300 135 070.
SUMMARY COMMENTARY
Footnote(s): Break in time series for trend between June and July 2000. See paragraph 13 of the Expanatory Notes.
New motor vehicle sales by type of vehicle by month
Passenger vehicles
Sports utility vehicles
Other vehicles
Total vehicles
Change Passenger vehicles
Change Sports utility vehicles
Change Other vehicles
Change Total vehicles
no.
no.
no.
no.
%
%
%
%
Trend
2012
May
47 323
25 304
18 857
91 485
-0.2
1.9
3.4
1.1
June
47 245
25 749
19 452
92 446
-0.2
1.8
3.2
1.1
July
47 450
26 067
19 919
93 437
0.4
1.2
2.4
1.1
August
47 989
26 254
20 213
94 456
1.1
0.7
1.5
1.1
September
48 617
26 347
20 408
95 372
1.3
0.4
1.0
1.0
October
49 081
26 425
20 566
96 072
1.0
0.3
0.8
0.7
November
49 183
26 534
20 657
96 374
0.2
0.4
0.4
0.3
December
48 849
26 715
20 616
96 181
-0.7
0.7
-0.2
-0.2
2013
January
48 219
26 977
20 480
95 675
-1.3
1.0
-0.7
-0.5
February
47 611
27 272
20 293
95 176
-1.3
1.1
-0.9
-0.5
March
47 271
27 519
20 062
94 852
-0.7
0.9
-1.1
-0.3
April
47 198
27 627
19 850
94 675
-0.2
0.4
-1.1
-0.2
May
47 263
27 642
19 710
94 615
0.1
0.1
-0.7
-0.1
June
47 346
27 620
19 646
94 612
0.2
-0.1
-0.3
-
July
47 569
27 591
19 606
94 767
0.5
-0.1
-0.2
0.2
Seasonally Adjusted
2012
May
48 716
25 306
19 018
93 040
3.7
2.0
2.0
2.9
June
46 814
25 642
18 428
90 884
-3.9
1.3
-3.1
-2.3
July
44 934
25 438
20 660
91 032
-4.0
-0.8
12.1
0.2
August
47 111
26 790
20 512
94 413
4.8
5.3
-0.7
3.7
September
49 516
27 228
20 549
97 293
5.1
1.6
0.2
3.1
October
48 960
26 566
20 290
95 815
-1.1
-2.4
-1.3
-1.5
November
50 196
24 957
20 278
95 431
2.5
-6.1
-0.1
-0.4
December
50 532
26 757
20 339
97 627
0.7
7.2
0.3
2.3
2013
January
46 580
27 692
21 087
95 359
-7.8
3.5
3.7
-2.3
February
46 101
27 793
21 506
95 400
-1.0
0.4
2.0
-
March
47 742
27 544
19 533
94 819
3.6
-0.9
-9.2
-0.6
April
47 333
27 430
18 704
93 467
-0.9
-0.4
-4.2
-1.4
May
46 869
27 446
19 480
93 795
-1.0
0.1
4.1
0.4
June
48 414
27 996
20 779
97 190
3.3
2.0
6.7
3.6
July
46 944
27 353
19 500
93 797
-3.0
-2.3
-6.2
-3.5
Original
2012
May
48 448
26 863
20 758
96 069
19.6
23.0
23.9
21.5
June
57 439
31 617
23 510
112 566
18.6
17.7
13.3
17.2
July
43 354
23 845
19 442
86 641
-24.5
-24.6
-17.3
-23.0
August
46 612
26 216
20 724
93 552
7.5
9.9
6.6
8.0
September
49 210
25 079
20 338
94 627
5.6
-4.3
-1.9
1.1
October
49 291
25 737
20 556
95 584
0.2
2.6
1.1
1.0
November
51 652
26 145
20 550
98 347
4.8
1.6
-
2.9
December
50 618
25 548
19 261
95 427
-2.0
-2.3
-6.3
-3.0
2013
January
41 957
26 623
16 850
85 430
-17.1
4.2
-12.5
-10.5
February
43 338
26 834
20 046
90 218
3.3
0.8
19.0
5.6
March
48 664
29 148
19 588
97 400
12.3
8.6
-2.3
8.0
April
42 844
24 384
17 889
85 117
-12.0
-16.3
-8.7
-12.6
May
46 774
29 152
20 862
96 788
9.2
19.6
16.6
13.7
June
57 636
34 398
26 724
118 758
23.2
18.0
28.1
22.7
July
46 318
25 568
18 349
90 235
-19.6
-25.7
-31.3
-24.0
- nil or rounded to zero (including null cells)
New motor vehicle sales by state/territory of registration
NSW
Vic.
Qld
SA
WA
Tas.(a)
NT(a)
ACT(a)
Aust.
no.
no.
no.
no.
no.
no.
no.
no.
no.
Trend
2012
May
28 177
24 022
19 442
5 594
10 526
1 322
971
1 431
91 485
June
28 459
24 217
19 715
5 620
10 646
1 349
984
1 457
92 446
July
28 693
24 497
19 965
5 656
10 767
1 391
990
1 477
93 437
August
28 905
24 840
20 173
5 715
10 898
1 442
990
1 492
94 456
September
29 085
25 179
20 311
5 798
11 024
1 490
983
1 502
95 372
October
29 217
25 409
20 393
5 886
11 151
1 525
977
1 514
96 072
November
29 255
25 464
20 409
5 957
11 247
1 544
973
1 525
96 374
December
29 173
25 379
20 315
6 003
11 266
1 546
969
1 530
96 181
2013
January
29 040
25 261
20 139
6 016
11 189
1 544
959
1 527
95 675
February
28 957
25 209
19 945
5 994
11 054
1 552
949
1 515
95 176
March
28 971
25 259
19 747
5 945
10 904
1 576
947
1 502
94 852
April
29 036
25 349
19 585
5 880
10 769
1 616
952
1 489
94 675
May
29 135
25 444
19 472
5 816
10 654
1 655
960
1 479
94 615
June
29 234
25 531
19 395
5 761
10 561
1 691
969
1 469
94 612
July
29 396
25 616
19 373
5 719
10 503
1 717
980
1 463
94 767
Seasonally Adjusted
2012
May
28 642
23 967
20 013
5 524
11 057
1 321
1 074
1 441
93 040
June
28 333
23 765
18 857
5 547
10 428
1 334
1 063
1 558
90 884
July
27 818
24 023
19 109
5 611
10 701
1 445
915
1 410
91 032
August
29 298
24 826
20 230
5 739
10 621
1 271
946
1 482
94 413
September
29 594
26 160
20 386
5 899
11 172
1 576
982
1 523
97 293
October
29 157
25 337
20 153
5 868
11 255
1 551
1 017
1 478
95 815
November
28 598
25 147
20 396
5 842
11 244
1 671
1 000
1 533
95 431
December
30 076
25 510
20 662
6 036
11 355
1 465
960
1 562
97 627
2013
January
28 637
25 240
19 923
6 410
11 045
1 667
904
1 533
95 359
February
28 940
25 329
20 002
5 916
11 207
1 530
979
1 497
95 400
March
29 008
24 671
20 164
5 844
11 000
1 640
965
1 528
94 819
April
28 629
25 599
18 859
5 902
10 572
1 554
916
1 435
93 467
May
28 924
25 364
19 209
5 698
10 471
1 668
976
1 486
93 795
June
30 198
26 010
20 167
5 835
10 762
1 753
939
1 526
97 190
July
28 998
25 342
19 132
5 710
10 486
1 686
1 020
1 423
93 797
Original
2012
May
29 811
24 600
20 933
5 689
11 025
1 266
1 252
1 493
96 069
June
34 785
28 662
25 051
6 728
12 698
1 443
1 357
1 842
112 566
July
26 594
22 991
18 234
5 298
9 968
1 268
917
1 371
86 641
August
28 706
24 696
19 791
5 577
11 072
1 365
898
1 447
93 552
September
28 854
25 263
19 579
5 821
11 054
1 651
918
1 487
94 627
October
28 792
26 078
19 602
5 848
11 228
1 612
949
1 475
95 584
November
30 030
25 740
20 368
6 024
11 676
2 015
938
1 556
98 347
December
28 619
25 238
20 116
6 265
11 014
1 772
859
1 544
95 427
2013
January
26 194
22 583
16 946
5 918
10 198
1 403
748
1 440
85 430
February
27 427
24 415
18 369
5 696
10 679
1 309
867
1 456
90 218
March
29 928
25 360
21 135
5 680
11 145
1 564
1 075
1 513
97 400
April
25 982
23 023
17 666
5 381
9 497
1 273
971
1 324
85 117
May
29 707
26 226
20 221
5 761
10 610
1 597
1 132
1 534
96 788
June
37 194
30 647
26 245
6 999
12 782
1 917
1 162
1 812
118 758
July
27 789
24 584
18 618
5 485
9 848
1 466
1 049
1 396
90 235
(a) Seasonally adjusted numbers of new motor vehicle sales in Tasmania, Northern Territory and Australian Capital Territory should be used with caution. For more information, see paragraph 7 of the Explanatory Notes.
Document Selection
These documents will be presented in a new window.
 Quality Declaration
  Print Page
 Print All