PART-TIME WORKERS
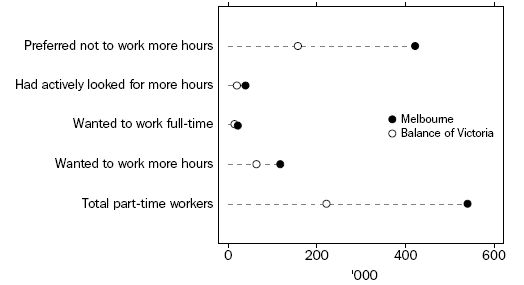
In August quarter 2007, there were 540,100 part-time workers in the Melbourne MSR. From August quarter 2006 to August quarter 2007 total part-time workers decreased by 5,000 persons (-0.9%) in the Melbourne MSR. Females accounted for the majority of part-time workers (69.8%) in the Melbourne MSR. Most part-time workers (78.2%) preferred not to work more hours, and this was more common amongst females than males.
In the Balance of Victoria, the total number of part-time workers in August quarter 2007 was 222,500, an increase of 15,500 persons (7.5%) since August quarter 2006. The majority of these part-time workers (71.1%) preferred not to work more hours. Again this response was more prevalent amongst females than males.
PART-TIME WORKER'S INTENTION: August quarter
- 2007

PART-TIME WORKERS(a), By Sex, Melbourne |
|
 | 2006 | 2007 |
 | Aug
Qtr | Nov
Qtr | Feb
Qtr | May
Qtr | Aug
Qtr |
MALES |
|
| Preferred not to work more hours ('000) | 112.6 | 110.9 | 100.0 | 113.8 | 116.3 |
| Had actively looked for more hours and were available to start last week ('000) | 23.6 | 15.7 | 22.9 | 18.8 | 17.2 |
| Wanted to work full-time ('000) | 16.9 | 11.7 | 16.9 | 14.7 | 11.6 |
| All part-time workers who preferred to work more hours ('000) | 53.5 | 47.1 | 57.2 | 49.4 | 46.9 |
| Total part-time workers ('000) | 166.1 | 158.0 | 157.3 | 163.2 | 163.1 |
| Proportion of part-time workers preferring to work more hours (%) | 32.2 | 29.8 | 36.4 | 30.3 | 28.7 |
FEMALES |
|
| Preferred not to work more hours ('000) | 301.5 | 303.7 | 288.7 | 306.7 | 305.9 |
| Had actively looked for more hours and were available to start last week ('000) | 28.6 | 25.6 | 25.9 | 21.5 | 22.0 |
| Wanted to work full-time ('000) | 13.5 | 15.2 | 15.4 | 10.2 | 10.6 |
| All part-time workers who preferred to work more hours ('000) | 77.5 | 74.9 | 75.8 | 69.1 | 71.0 |
| Total part-time workers ('000) | 379.0 | 378.6 | 364.5 | 375.8 | 377.0 |
| Proportion of part-time workers preferring to work more hours (%) | 20.5 | 19.8 | 20.8 | 18.4 | 18.8 |
PERSONS |
|
| Preferred not to work more hours ('000) | 414.1 | 414.6 | 388.7 | 420.4 | 422.2 |
| Had actively looked for more hours and were available to start last week ('000) | 52.2 | 41.3 | 48.7 | 40.4 | 39.2 |
| Wanted to work full-time ('000) | 30.4 | 26.9 | 32.3 | 25.0 | 22.2 |
| All part-time workers who preferred to work more hours ('000) | 131.0 | 122.0 | 133.1 | 118.5 | 117.9 |
| Total part-time workers ('000) | 545.1 | 536.6 | 521.8 | 538.9 | 540.1 |
| Proportion of part-time workers preferring to work more hours (%) | 24.0 | 22.7 | 25.5 | 22.0 | 21.8 |
|
| (a) Civilian population aged 15 years and over. |
| Source: ABS data available on request, Labour Force Survey. |
PART-TIME WORKERS(a), By Sex, Balance of Victoria |
|
 | 2006 | 2007 |
 | Aug
Qtr | Nov
Qtr | Feb
Qtr | May
Qtr | Aug
Qtr |
MALES |
|
| Preferred not to work more hours ('000) | 32.6 | 37.6 | 36.6 | 40.7 | 41.1 |
| Had actively looked for more hours and were available to work more hours ('000) | 9.7 | 6.8 | 7.4 | 7.3 | 8.7 |
| Wanted to work full-time ('000) | 8.7 | 6.1 | 6.7 | 4.7 | 7.7 |
| All part-time workers who preferred to work more hours ('000) | 19.7 | 18.8 | 20.6 | 17.8 | 23.6 |
| Total part-time workers ('000) | 52.3 | 56.5 | 57.2 | 58.5 | 64.8 |
| Proportion of part-time workers preferring to work more hours (%) | 37.6 | 33.4 | 36.0 | 30.4 | 36.5 |
FEMALES |
|
| Preferred not to work more hours ('000) | 115.3 | 113.2 | 123.1 | 111.6 | 117.2 |
| Had actively looked for more hours and were available to work more hours ('000) | 8.6 | 9.3 | 15.5 | 11.2 | 11.7 |
| Wanted to work full-time ('000) | 5.5 | 6.0 | 8.9 | 7.7 | 7.2 |
| All part-time workers who preferred to work more hours ('000) | 39.4 | 31.8 | 35.2 | 42.3 | 40.6 |
| Total part-time workers ('000) | 154.7 | 145.0 | 158.2 | 153.9 | 157.7 |
| Proportion of part-time workers preferring to work more hours (%) | 25.5 | 21.9 | 22.2 | 27.5 | 25.7 |
PERSONS |
|
| Preferred not to work more hours ('000) | 147.9 | 150.8 | 159.7 | 152.3 | 158.3 |
| Had actively looked for more hours and were available to work more hours ('000) | 18.3 | 16.1 | 22.9 | 18.4 | 20.5 |
| Wanted to work full-time ('000) | 14.2 | 12.1 | 15.6 | 12.5 | 14.9 |
| All part-time workers who preferred to work more hours ('000) | 59.1 | 50.6 | 55.7 | 60.1 | 64.2 |
| Total part-time workers ('000) | 207.0 | 201.4 | 215.4 | 212.4 | 222.5 |
| Proportion of part-time workers preferring to work more hours (%) | 28.6 | 25.1 | 25.9 | 28.3 | 28.9 |
|
| (a) Civilian population aged 15 years and over. |
| Source: ABS data available on request, Labour Force Survey. |
 Print Page
 Print All
 Print Page
 Print All