 Quality Declaration
Page tools:
 Print Page Print Page
 Print All Print All
| ||
|
CHARACTERISTICS OF LOW, MIDDLE AND HIGH WEALTH HOUSEHOLDS Around 55% of low wealth households also have relatively low incomes, while around 12% of low wealth households are in the top three income deciles. This pattern is reversed for high wealth households, with 52% also having relatively high incomes and about 15% having high wealth but relatively low incomes as shown in Graph 1.  by wealth group(b), 2013-14.GIF) Footnote(s): (a) Based on Equivalised Disposable Household Income (b) Based on net worth of the household Source(s): Graph data SIH For low wealth households, the main assets are other non-financial assets, such as dwelling contents and vehicles, at 42% of their wealth. As a group, 12% of their wealth is held in owner occupied dwellings which reflects the lower level of home ownership in this group with only 3.4% owning the dwelling they live in. In contrast, for middle and high wealth households, the main asset is owner occupied dwellings as a result of over 90% of households in these groups owning the dwelling they live in. For middle and high wealth households, owner occupied dwellings contributed nearly 60% and 33% respectively to their wealth, as can be seen in Graph 2. 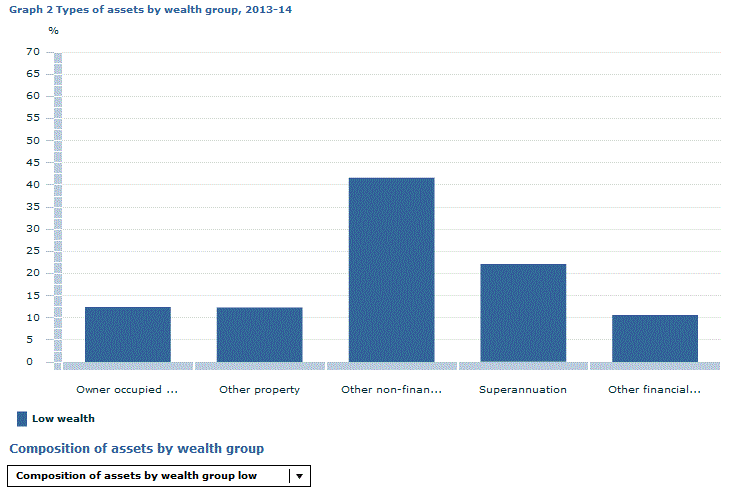 Footnote(s): (a) Includes contents of dwelling and vehicles (b) Includes accounts held in financial institutions (excludes offset accounts), offset accounts, shares (excludes own incorporated business), public unit trusts, private trusts, own incorporated business (net of liabilities) and own unincorporated business (net of liabilities) Source(s): Graph data SIH As shown in Graph 3, the major source of liabilities for high and middle wealth households are loans to purchase owner occupied dwellings and other properties. Property loans made up 87% of total liabilities for the high wealth households, while 44% of this group had property liabilities. Middle wealth households had property loans accounting for 94% of total liabilities, with 55% of this group having property liabilities. This drops significantly to 64% of total liabilities for low wealth households, where only 5.2% have an owner occupied dwelling or other property liability. Additionally, 17% of low wealth households have debt outstanding on study loans which accounts for 16% of total liabilities for all low wealth households. This drops to less than 2% of total liabilities for both middle and high wealth households due to the high value of other liabilities for these groups. Around 14% of middle and high wealth households have study loans, which is slightly less than for low wealth households (17%). 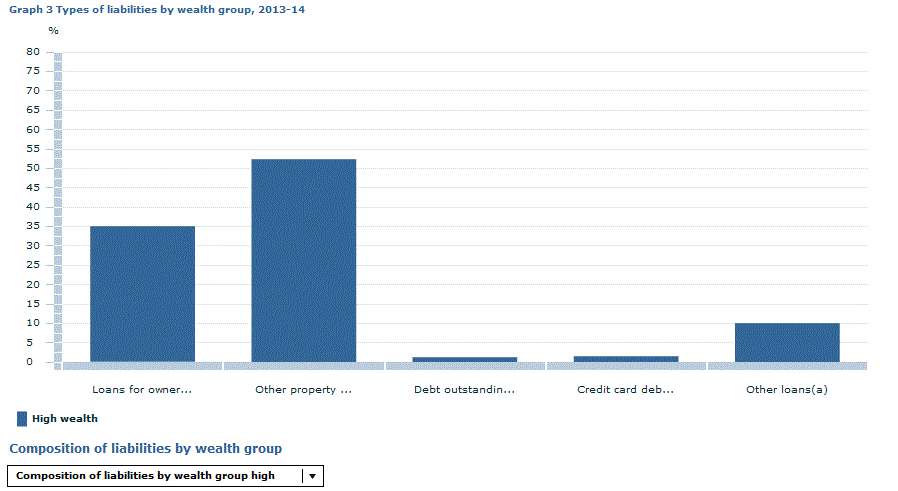 Footnote(s): (a) Includes principal outstanding on loans for vehicle purchases (excludes business and investment loans), principal outstanding on investment loans (excludes business and rental property loans), and principal outstanding on loans for other purposes (excludes business and investment loans) Source(s): Graph data SIH Document Selection These documents will be presented in a new window.
|
|
