DECEMBER QTR KEY FIGURES
 | Sep Qtr 05 to Dec Qtr 05 | Dec Qtr 04 to Dec Qtr 05 |
| Established house prices | % change | % change |
|
| Weighted average of eight capital cities | 2.1 | 2.3 |
| Sydney | 1.0 | -3.9 |
| Melbourne | 2.3 | 2.9 |
| Brisbane | 2.0 | 3.5 |
| Adelaide | 1.1 | 3.4 |
| Perth | 6.6 | 22.5 |
| Hobart | 1.8 | 5.4 |
| Darwin | 6.1 | 23.2 |
| Canberra | 0.9 | 0.8 |
|
Established house prices, Weighted average of eight capital cities - Quarterly % change

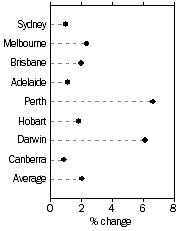
| Established house prices, Quarterly % change - December quarter 2005
|
DECEMBER QTR KEY POINTS
ESTABLISHED HOUSE PRICES
Quarterly Changes
- Preliminary estimates show the price index for established houses in Australia increased 2.1% in the December quarter 2005, compared with no movement in the September quarter 2005.
- House prices rose in Perth (+6.6%), Darwin (+6.1%), Melbourne (+2.3%), Brisbane (+2.0%), Hobart (+1.8%), Adelaide (+1.1%), Sydney (+1.0%) and Canberra (+0.9%).
- The movement in the established house price index between June and September quarters 2005 has been revised from an estimated preliminary fall of 1.0% to no change.
Annual Changes (December quarter 2004 to December quarter 2005)
- Over the twelve months to December quarter 2005, preliminary estimates show that established house prices rose 2.3%.
- Annually, house prices rose in Darwin (+23.2%), Perth (+22.5%), Hobart (+5.4%), Brisbane (+3.5%), Adelaide (+3.4%), Melbourne (+2.9%) and Canberra (+0.8%). House prices fell in Sydney by 3.9%.
- The movement in the established house price index between December quarters 2004 and 2005 has been revised from an estimated preliminary rise of 1.0% to a rise of 1.9%.
NOTES
FORTHCOMING ISSUES
| ISSUE (QUARTER) | Release Date |
| March 2006 | 25 May 2006 |
| June 2006 | 24 August 2006 |
CHANGES IN THIS ISSUE
A new table (Table 9 Revisions to Established House Price Index Series, Australia) is introduced with this publication. This table presents revisions in estimates of the 'leading indicator' terms, when compared with the subsequent final estimate, for the Established House Price Index, Weighted Average 8 Capital Cities. Equivalent capital city tables for these revisions are available from this site. (Refer to the data cube under the 'Details' tab for House Price Index: Eight Capital Cities (cat. no. 6416.0).)
For more information on the 'leading indicator' terms, see paragraphs 12-15 of the Explanatory Notes.
HISTORIC ESTABLISHED HOUSE PRICE INDEX
The current methodology for calculating the established house price index was introduced in September quarter 2005, with historic data commencing in March quarter 2002. The previous established house price index, calculated using the pre-September quarter 2005 methodology, is available as time series spreadsheet table 10 of House Price Indexes: Eight Capital Cities (cat. no. 6416.0) on this site. The series commences in June quarter 1986 and concludes in June quarter 2005.
The table has been presented for historical purposes for users who may be interested in an indicator of established house prices movements over a longer period than is available using the current methodology. Because of the different methodologies used to calculate this historical series and the new established house price index series, it is not recommended that the historical series be used as a proxy for back-casting the new established house price index for periods prior to March quarter 2002.
INQUIRIES
For further information about these and related statistics, contact Mark King on Canberra (02) 6252 5342 or the National Information and Referral Service on 1300 135 070.
 Print Page
 Print All