Notes
About this issue
This is a new issue which presents the results of a study of the foreign ownership characteristics of businesses engaged in economic activity in Australia in 2000-01. This study is the first to cover all industries (except Agriculture, forestry and fishing) for the same reference year.
Comments
The ABS welcomes comments and suggestions from users. Comments should be addressed to the Director, Globalisation Section, Australian Bureau of Statistics, Locked Bag 10, Belconnen ACT 2616.
Rounding
Where figures have been rounded, discrepancies may occur between the sum of component items and the total.
Inquiries
For further information about these and related statistics, contact the National Information and Referral Service on 1300 135 070 or Glen Malam on Canberra 02 62525040.
Summary Commentary
Introduction
The ABS has compiled traditional economic indicators for foreign trade and foreign direct investment for many years. While these data give some structural information, the ABS has not regularly compiled data for the economic activity of multinational firms, nor the international dissemination of technology (both important globalisation indicators). In recent years the ABS has embarked on a series of case studies to test the feasibility of synthesising activity data for multinationals and indicators of technology dissemination by combining data from a number of sources. Early studies examined new capital expenditure by multinationals, the economic activity of multinationals in the mining and information technology industries, and research and development activities of multinationals in Australia.
This study is the most ambitious to date. It covers the economic activities of identified majority foreign-owned businesses(Footnote: Country of majority ownership could not be identified for a large number of businesses (see Explanatory Notes). Hereafter the words 'identified majority' are omitted but are implied.) in the Australian economy, covering all employing businesses in all industries except agriculture, forestry and fishing.
This study uses source data collected by the ABS as part of the 2000-2001 annual Economic Activity Survey (EAS), published in Business Operations and Industry Performance, 2000-2001 (cat. no. 8140.0). This survey was based on a sample of about 20,000 management units selected from the ABS Business Register. Foreign ownership characteristics of businesses responding to the EAS were identified by matching the data for the EAS businesses with the foreign ownership data for the same businesses from the ABS Survey of International Investment for those businesses included in both surveys. For other businesses, a number of other sources were used, with most ownership data compiled from extensive Internet searches.
The range of statistics about foreign-owned businesses presented in this study is similar to that presented in Business Operations and Industry Performance. Note that EAS data relate to the management unit, defined as the highest level unit within a business for which a set of management accounts is maintained, rather than to the enterprise or establishment (as required by the international standard for globalisation statistics). Further information about the scope and coverage are provided in the explanatory notes.
PREVIOUS STUDIES
Several globalisation case studies were undertaken prior to this exercise to examine the foreign ownership characteristics of businesses in particular areas of interest. The study of businesses in the Mining industry in 1997-98 showed that foreign-owned businesses made a larger contribution to industry turnover than Australian-owned businesses(Footnote: Identified as majority Australian-owned.), but a lower contribution to industry employment and capital expenditure. Expenditure on wages and salaries by the Mining industry was shared evenly between foreign-owned and Australian-owned businesses.
A study of the ownership of businesses undertaking capital expenditure for the 1998-99 financial year showed the lower contribution of foreign-owned businesses to capital expenditure was not restricted to the Mining industry, with the capital expenditure by foreign-owned businesses less than half the capital expenditure by Australian-owned businesses.
A study of research and experimental development activity for the 1999-2000 financial year found that foreign-owned businesses spent almost as much on research and experimental development as Australian-owned businesses. The Manufacturing industry experienced the largest levels of research and experimental development activity, with foreign-owned and Australian-owned businesses contributing equally. Foreign-owned businesses dominated research and experimental development activity by Wholesale and Retail businesses, both in terms of research and experimental development expenditure and human resources devoted to research and experimental development.
Two studies were undertaken examining the foreign ownership characteristics of specialist Information Technology (IT) businesses. The most recent examined the activity of IT businesses in 2000-01 and updated a previous study of IT businesses for 1998-99. In both studies, foreign-owned businesses dominated the IT components of the Wholesale industry. Foreign-owned businesses significantly increased activity in the IT components of the Manufacturing industry between 1998-99 and 2000-01 to the extent that, by 2000-01, they dominated that industry also. In the Computer services industry, both Australian-owned and foreign-owned businesses increased economic activity by roughly the same magnitude so that, as with the 1998-99 study, the 2000-01 study found that foreign-owned businesses provided a similar level of employment to Australian-owned businesses, but they accounted for more than half the income. In both studies, majority USA-owned businesses had the largest economic activity of foreign-owned businesses to the extent that they were comparable to Australian-owned businesses in terms of employment and exceeded Australian-owned businesses in terms of income.
Summary
As part of an initiative to provide a range of economic globalisation indicators, the ABS has embarked on a series of studies of the economic activity of majority foreign-owned businesses in Australia(Footnote: Businesses are deemed to be majority foreign-owned if more than 50% of their equity is held by non-residents.).
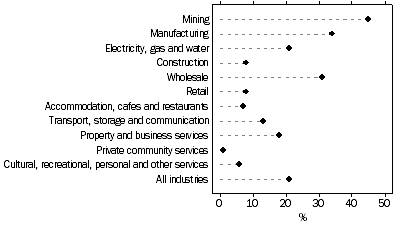
The most recent study examines the foreign ownership characteristics of a wide range of businesses engaged in economic activity in Australia in 2000-2001. Majority foreign-owned businesses made a significant contribution to the Australian economy overall (21%), with notable contributions in the Mining and Manufacturing industries where they contributed 45% and 34% of industry value added, respectively.
Majority Foreign-Owned Businesses: Industry Value Added by selected Country of Owner, All industries excluding agriculture, forestry and fishing, 2000-01
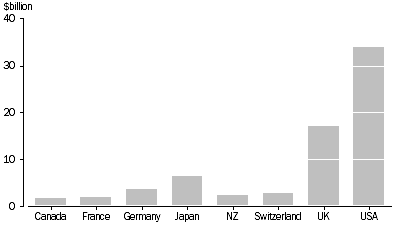
Majority USA-owned businesses made a greater contribution to the Australian economy, in terms of almost all indicators, than businesses owned by residents of any other foreign country. The contribution by USA-owned businesses to Australian employment, income, expenses and value added was approximately twice the contribution of businesses from the second largest country of ownership (UK); however in terms of operating profit, the UK made a larger contribution. For capital items (assets, liabilities and gross fixed capital formation), the USA was again the largest contributor, with the UK contribution being between 75% and 90% of the USA contribution.
Majority USA-owned businesses accounted for the largest contribution to industry value added for each of the industry groups included in the study except the Transport, storage and communication services industry. Majority UK-owned businesses dominated the Transport, storage and communication services industry, with New Zealand-owned businesses accounting for the second-highest industry value added in that industry.
ALL INDUSTRIES
The estimated number of foreign-owned businesses in Australia was 7,864 at the end of the 2000-01 financial year (approximately 1% of all businesses in Australia). They employed 783,300 workers (12% of all employees in Australia), contributed $12,566m to gross fixed capital formation (25% of all gross fixed capital formation in Australia) and contributed $78,056m to value added (21% of total value added in Australia). A country breakdown of business activity by country is provided in Table 1.
In terms of business numbers, USA residents owned significantly more businesses in Australia than the residents of any other foreign country and more than four times as many businesses as the UK (3,439 and 792 respectively). The contribution by USA-owned businesses was approximately twice the contribution of UK-owned businesses in terms of employment (331,000 and 140,500 employees, respectively) and industry value added ($33,911m and $17,119m respectively). In contrast, UK-owned businesses accounted for $3,685m of gross fixed capital formation, 90% of the contribution by USA-owned businesses ($4,114m); and accounted for higher operating profit than USA-owned businesses ($9,602m and $8,821m respectively).
Business Activity and Characteristics by Country of Owner, All industries excluding agriculture, forestry and fishing, 2000-01 |
|  |
 | Operating Businesses | Employment | Gross Fixed Capital Formation | Industry Value Added |  |
 | no. | '000 | $m | $m |  |
|  |
| Austria | 7 | 1.9 | *-5 | 78 |  |
| Belgium | 8 | 3.6 | 34 | 110 |  |
| Canada | 49 | 20.5 | 337 | 1,732 |  |
| Finland | **36 | **5.4 | **60 | *523 |  |
| France | 113 | 23.9 | -1,152 | 1,837 |  |
| Germany | *378 | 28.3 | 1,152 | 3,557 |  |
| Hong Kong | **440 | *11.6 | 296 | 1,162 |  |
| India | **24 | **1.1 | np | *132 |  |
| Italy | *8 | 3.7 | 75 | 211 |  |
| Japan | *347 | 41.9 | 1,128 | 6,424 |  |
| Netherlands | 45 | 43.3 | 979 | 1,208 |  |
| New Zealand | **871 | 39.4 | 1,060 | 2,440 |  |
| Singapore | *47 | 5.7 | 33 | 900 |  |
| South Africa | **632 | 13.6 | 196 | 925 |  |
| Sweden | *101 | 14.6 | np | 1,396 |  |
| Switzerland | **167 | 40.2 | 295 | 2,953 |  |
| UK | 792 | 140.5 | 3,685 | 17,119 |  |
| USA | *3,439 | 331.0 | 4,114 | 33,911 |  |
| Other countries | *359 | 13.1 | 278 | 1,438 |  |
| Total foreign | 7,864 | 783.3 | 12,566 | 78,056 |  |
|  |
np not available for publication but included in "Other countries".
* estimate has a relative standard error of between 25% and 50% and should be used with caution.
** estimate has a relative standard error greater than 50% and is considered too unreliable for general use. |
In 2000-01, foreign-owned businesses played an important role in the Mining, Manufacturing and Wholesale industries, contributing 45%, 34% and 31% of industry value added respectively. Foreign-owned businesses were also significant contributors to industry value added in the Electricity, gas and water, Property and business services, and Transport, storage and communication industries (21%, 18% and 13% respectively).
Industry Value Added Accounted for by Foreign-Owned Businesses, By industry, 2000-01
MINING
Historically, the Australian Mining industry has been a major recipient of foreign investment. Foreign investment in the mining industry totalled $65.9 billion in 2000-01, accounting for nearly 8% of all foreign investment in Australia. In 2000-01, 48% of all mining industry assets were owned by foreign-owned businesses which employed 28% of the workforce and produced 45% of industry value added.
Business Activity and Characteristics by Country of Owner, Mining Industry, 2000-01 |
|  |
 | Operating Businesses | Employment | Gross Fixed Capital Formation | Industry Value Added |  |
 | no. | '000 | $m | $m |  |
|  |
| Canada | 7 | 1.3 | *127 | 304 |  |
| China | 5 | np | np | 64 |  |
| Japan | 40 | 1.0 | 419 | 2,574 |  |
| South Africa | 6 | 2.5 | 163 | 474 |  |
| Switzerland | 12 | 1.7 | 36 | 397 |  |
| UK | *21 | 6.3 | 120 | 4,573 |  |
| USA | *60 | 6.4 | 1,403 | 6,397 |  |
| Other countries | 18 | 0.3 | 898 | 503 |  |
| Total foreign | 169 | 19.6 | 3,167 | 15,286 |  |
|  |
np not available for publication but included in "Other countries".
* estimate has a relative standard error of between 25% and 50% and should be used with caution. |
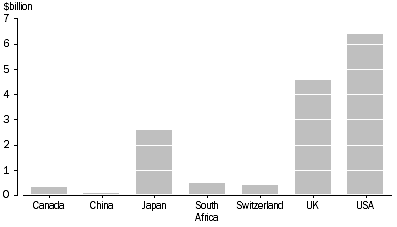
In terms of business numbers, USA residents owned 60 mining businesses (4% of all mining businesses), while residents of Japan owned 40 businesses and UK residents owned 21. In terms of employment, USA-owned businesses and UK-owned businesses accounted for approximately the same number of employees (6,400 and 6,300 employees respectively). In contrast, USA-owned businesses were by far the biggest investors in gross fixed capital formation, followed by Japan, South Africa, Canada and the UK. USA-owned businesses contributed 19% of industry value added, while UK-owned businesses contributed 13%. More detailed information is provided in Table 2.
Industry Value Added by selected Country of Owner, Mining, 2000-01
MANUFACTURING
Foreign investment in the Manufacturing industry totalled $107.2 billion in 2000-01, accounting for 13% of all foreign investment in Australia. In 2000-01 foreign-owned businesses employed 23% of the workers in the Manufacturing industry, accounted for 38% of total industry income and 44% of the gross operating profit, and contributed 34% of industry value added. Foreign-owned businesses owned 36% of total assets and contributed 42% of total fixed capital formation in Manufacturing in 2000-01.
Business Activity and Characteristics by Country of Owner, Manufacturing Industry, 2000-01 |
|  |
 | Operating Businesses | Employment | Gross Fixed Capital Formation | Industry Value Added |  |
 | no. | '000 | $m | $m |  |
|  |
| Austria | 3 | 0.5 | np | 36 |  |
| Canada | *31 | 9.7 | 163 | 806 |  |
| Finland | 5 | 1.9 | 5 | 180 |  |
| France | 30 | 7.9 | 47 | 1,115 |  |
| Germany | 46 | 6.8 | 267 | 792 |  |
| Italy | 3 | 3.5 | np | 188 |  |
| Japan | 39 | 16.7 | 365 | 1,710 |  |
| Malaysia | **17 | *0.8 | np | *54 |  |
| Netherlands | 13 | 6.2 | 217 | 1,027 |  |
| New Zealand | 24 | 7.1 | 112 | 536 |  |
| Singapore | **16 | *1.2 | 8 | 75 |  |
| Sweden | 9 | 6.1 | 38 | 456 |  |
| Switzerland | 23 | 9.3 | 168 | 1,144 |  |
| UK | 105 | 40.4 | 757 | 5,052 |  |
| USA | 373 | 89.2 | 1,137 | 10,600 |  |
| Other countries | **83 | 7.0 | 212 | 1,016 |  |
| Total foreign | 821 | 214.4 | 3,497 | 24,787 |  |
|  |
np not available for publication but included in "Other countries".
* estimate has a relative standard error of between 25% and 50% and should be used with caution.
** estimate has a relative standard error greater than 50% and is considered too unreliable for general use. |
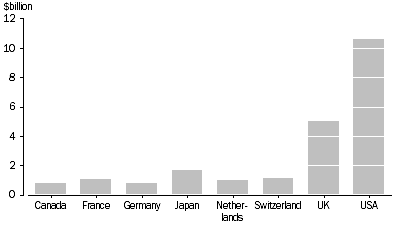
In 2000-01, USA-owned businesses spent more on gross capital formation than businesses owned by any other foreign country (accounting for nearly 14% of the total), contributed more to industry value added (approximately 15% of the total) and employed the most workers (more than 9% of the total). More detailed information on foreign-owned businesses in the Manufacturing industry is provided in Table 3.
Industry Value Added by selected Country of Owner, Manufacturing, 2000-01
Industry detail
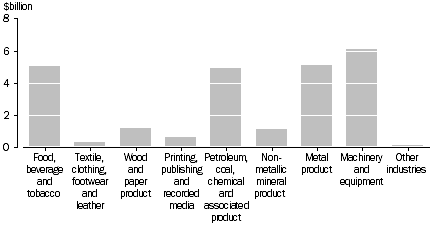
Table 4 shows the involvement of foreign-owned businesses at the 2-digit ANZSIC level. Foreign-owned businesses contributed over 40% of the value added of the following industries: Petrochemical, coal, chemical and associated product; Machinery and equipment; over 30% of the industry value added for the Metal product; Food, beverage and tobacco; and Non-metallic mineral product industries; and 25% of the industry value added of the Wood and paper product industry. There was less foreign involvement in the remaining industries - Textiles, clothing, footwear and leather (13% of industry value added), Printing, publishing and recorded media manufacturing (10% of industry value added) and Other manufacturing (7% of industry value added).
Industry Value Added by Foreign-Owned Businesses, Manufacturing—Detailed Industry, 2000-01
ELECTRICITY, GAS AND WATER SUPPLY
In 2000-01, foreign-owned businesses owned 21% of the assets, invested 14% in capital formation, employed 17% of the workers and contributed 21% of industry value added. However, their share of the profit was only approximately 1%. Due to the small number of foreign-owned businesses in this industry, only data about USA-owned businesses can be released. Additional information for foreign-owned businesses in this industry is provided in Table 5.
Business Activity and Characteristics by Country of Owner, Electricity, gas and water industry, 2000-01 |
|  |
 | Operating Businesses | Employment | Gross Fixed Capital Formation | Industry Value Added |  |
 | no. | '000 | $m | $m |  |
|  |
| USA | 10 | 2.6 | 190 | 1,291 |  |
| Other countries | 13 | 5.6 | 406 | 1,823 |  |
| Total foreign | 23 | 8.2 | 596 | 3,114 |  |
|  |
CONSTRUCTION
Foreign-owned businesses made only a minor contribution to the Australian Construction industry in 2000-01 (refer to Table 6). These businesses employed less than 6% of all employees in the industry, owned 9% of the total assets, earned 8% of income and 7% of profits. These businesses also contributed 4% of gross fixed capital formation and 8% of industry value added.
USA-owned businesses made the largest contribution to industry value added, with nearly 3%, followed by the UK with nearly 1%. Since the Construction industry includes a high proportion of small, highly mobile, businesses, it has not been possible to ascertain the ownership characteristics of a comparatively high number of them, but the majority were most probably Australian-owned.
Business Activity and Characteristics by Country of Owner, Construction, 2000-01 |
|  |
 | Operating Businesses | Employment | Gross Fixed Capital Formation | Industry Value Added |  |
 | no. | '000 | $m | $m |  |
|  |
| UK | *8 | 2.6 | 23 | 192 |  |
| USA | 10 | 8.3 | 15 | 636 |  |
| Other countries | **791 | 9.0 | 15 | *815 |  |
| Total foreign | **809 | 20.0 | 53 | 1,644 |  |
|  |
* estimate has a relative standard error of between 25% and 50% and should be used with caution.
** estimate has a relative standard error greater than 50% and is considered too unreliable for general use. |
WHOLESALE TRADE
Foreign-owned businesses made a significant contribution to the Wholesale trade industry in 2000-01 (refer to Table 7). Only 4% of Wholesale businesses were foreign-owned; however they employed 20% of the work force, owned 36% of the total assets, accounted for 34% of the industry's profit and contributed 31% of industry value added.
Business Activity and Characteristics by Country of Owner, Wholesale, 2000-01 |
|  |
 | Operating Businesses | Employment | Gross Fixed Capital Formation | Industry Value Added |  |
 | no. | '000 | $m | $m |  |
|  |
| Germany | **295 | *13.6 | *117 | *1,710 |  |
| Japan | **224 | *14.1 | 93 | 1,305 |  |
| Netherlands | 5 | 3.3 | np | 141 |  |
| South Africa | 6 | 4.1 | 12 | 213 |  |
| Sweden | *68 | 7.8 | np | 906 |  |
| UK | *78 | *6.7 | 49 | *661 |  |
| USA | **949 | 36.8 | 202 | 3,883 |  |
| Other countries | **122 | 6.2 | 74 | 643 |  |
| Total foreign | *1,746 | 92.7 | 547 | 9,462 |  |
|  |
np not available for publication but included in "Other countries".
* estimate has a relative standard error of between 25% and 50% and should be used with caution.
** estimate has a relative standard error greater than 50% and is considered too unreliable for general use. |
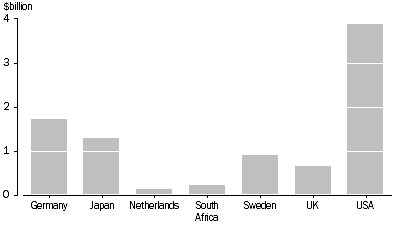
Businesses owned by USA residents made the largest contribution to industry value added (13%), with German and Japanese-owned businesses also being significant contributors (6% and 4% respectively).
Industry Value Added by selected Country of Owner, Wholesale, 2000-01
RETAIL TRADE
In 2000-01 the level of foreign ownership in the Retail industry was comparatively low by all measures (refer to Table 8). Foreign-owned firms employed 8% of the retail work force and contributed 8% of industry value added. Foreign-owned firms contributed 17% of total expenditure on gross fixed capital formation but earned only 4% of profits.
Business Activity and Characteristics by Country of Owner, Retail, 2000-01 |
|  |
 | Operating Businesses | Employment | Gross Fixed Capital Formation | Industry Value Added |  |
 | no. | '000 | $m | $m |  |
|  |
| Japan | *11 | *2.2 | *4 | *111 |  |
| New Zealand | 4 | 5.4 | 24 | 174 |  |
| South Africa | 4 | 4.4 | 14 | 152 |  |
| USA | **33 | 39.1 | *133 | *1,541 |  |
| Other countries | *47 | 34.2 | 169 | *658 |  |
| Total foreign | *99 | 85.3 | 343 | *2,635 |  |
|  |
* estimate has a relative standard error of between 25% and 50% and should be used with caution.
** estimate has a relative standard error greater than 50% and is considered too unreliable for general use. |
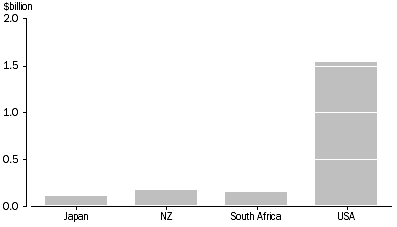
USA-owned businesses accounted for nearly half of total employment by foreign-owned businesses and over half of the industry value added of foreign-owned businesses.
Industry Value Added by selected Country of Owner, Retail, 2000-01
ACCOMMODATION, CAFES AND RESTAURANTS
The level of foreign ownership in the Accommodation, cafes and restaurants industry was quite low in 2000-01 (refer to Table 9), providing employment for 7% of workers, earning 7% of income and contributing 7% of industry value added.
Business Activity and Characteristics by Country of Owner, Accommodation, cafes and restaurants, 2000-01 |
|  |
 | Operating Businesses | Employment | Gross Fixed Capital Formation | Industry Value Added |  |
 | no. | '000 | $m | $m |  |
|  |
| Japan | 7 | 3.4 | np | 123 |  |
| Singapore | **6 | 1.7 | 1 | 71 |  |
| UK | 7 | 6.6 | 1 | 190 |  |
| USA | **35 | *8.1 | *17 | *282 |  |
| Other countries | **58 | *12.4 | 44 | *401 |  |
| Total foreign | *114 | 32.2 | 63 | 1,067 |  |
|  |
np not available for publication but included in "Other countries".
* estimate has a relative standard error of between 25% and 50% and should be used with caution.
** estimate has a relative standard error greater than 50% and is considered too unreliable for general use. |
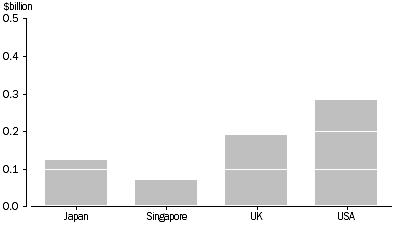
Japanese-owned businesses owned nearly 7% of total assets, but employed less than 1% of workers. On the other hand, USA-owned businesses owned 3% of total assets but employed more than twice as many workers as Japanese-owned businesses.
Industry Value Added by selected Country of Owner, Accommodation, cafes and restaurants, 2000-01
TRANSPORT, STORAGE AND COMMUNICATION
There was a moderate level of foreign ownership in the Transport, storage and communication industries in 2000-01 (refer to Table 10). Foreign-owned businesses provided 14% of employment and 13% of industry value added.
Business Activity and Characteristics by Country of Owner, Transport, storage and communication, 2000-01 |
|  |
 | Operating Businesses | Employment | Gross Fixed Capital Formation | Industry Value Added |  |
 | no. | '000 | $m | $m |  |
|  |
| France | **25 | *1.2 | *31 | *110 |  |
| Germany | **12 | 1.6 | *3 | 95 |  |
| Japan | 4 | 0.8 | np | 43 |  |
| New Zealand | **11 | 15.7 | np | 941 |  |
| Switzerland | *9 | 2.1 | 9 | *125 |  |
| UK | 34 | 19.5 | np | 3,369 |  |
| USA | *31 | 6.5 | 421 | 786 |  |
| Other countries | **160 | 13.2 | 3,366 | **-34 |  |
| Total foreign | *287 | 60.6 | 3,830 | 5,434 |  |
|  |
np not available for publication but included in "Other countries".
* estimate has a relative standard error of between 25% and 50% and should be used with caution.
** estimate has a relative standard error greater than 50% and is considered too unreliable for general use. |
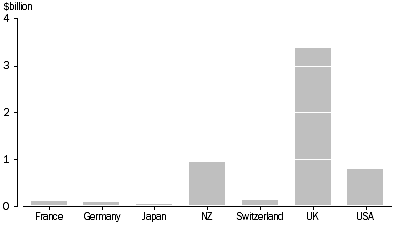
UK-owned businesses employed over 4% of workers and contributed 8% of industry value added, ahead of New Zealand (3.5% and 2%) and the USA (1.5% and nearly 2%). There were a large number of very small operators in this industry whose ownership characteristics could not be established, however most were probably Australian-owned. It was necessary to combine Communication with Transport and storage for confidentiality reasons as both the Transport and storage industry and Communication industry are dominated by a very small number of comparatively large businesses.
Industry Value Added by selected Country of Owner, Transport, storage and communication, 2000-01
FINANCE AND INSURANCE
In Table 11, summary information is provided on foreign ownership in the Finance and insurance industries in 2000-01. Foreign-owned businesses accounted for 20% of total assets, 18% of total employment and 20% of income.
Businesses owned by USA, UK and French residents made significant contributions to total assets (5%, 4% and 3% respectively) and employment (7%, 5% and 1% respectively). Only sparse data for gross fixed capital formation can be published, for confidentiality reasons.
Business Activity and Characteristics by Country of Owner, Finance and insurance, 2000-01 |
|  |
 | Operating Businesses | Employment | Gross Fixed Capital Formation | Industry Value Added |  |
 | no. | '000 | $m | $m |  |
|  |
| France | *30 | 3.7 | np | . . |  |
| Japan | *8 | *0.2 | np | . . |  |
| Netherlands | 11 | 2.3 | 34 | . . |  |
| Switzerland | *18 | 3.7 | np | . . |  |
| UK | **133 | 15.8 | *85 | . . |  |
| USA | **308 | 22.9 | np | . . |  |
| Other countries | **124 | 5.5 | *-887 | . . |  |
| Total foreign | *632 | 54.0 | *-768 | . . |  |
|  |
. . not applicable
np not available for publication but included in "Other countries".
* estimate has a relative standard error of between 25% and 50% and should be used with caution.
** estimate has a relative standard error greater than 50% and is considered too unreliable for general use. |
 |  |  |  |  |  |
 |
PROPERTY AND BUSINESS SERVICES
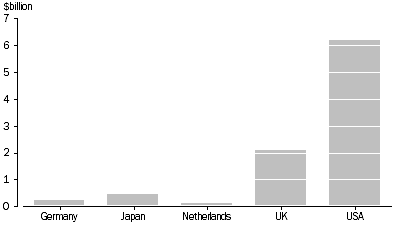
In 2000-01, foreign-owned businesses provided 15% of total employment and 18% of industry value added of the Property and business services industry (refer to Table 12). Businesses owned by USA residents provided 8% of all employment in this industry, owned 4% of all assets and contributed 10% of industry value added. In contrast, businesses owned by UK residents owned 7% of all assets, but only provided 3% of all employment and contributed 3% of industry value added. Since this industry includes a very high proportion of small businesses, it has not been possible to ascertain the ownership characteristics of a comparatively high number of them, but most are believed to be Australian-owned.
Business Activity and Characteristics by Country of Owner, Property and business services, 2000-01 |
|  |
 | Operating Businesses | Employment | Gross Fixed Capital Formation | Industry Value Added |  |
 | no. | '000 | $m | $m |  |
|  |
| Germany | 4 | 0.8 | np | 218 |  |
| Japan | *11 | 2.4 | np | 451 |  |
| Netherlands | 4 | 1.7 | np | 96 |  |
| Norfolk Island | 3 | - | - | *1 |  |
| UK | *301 | 28.4 | 51 | *2,086 |  |
| USA | **1,504 | 89.3 | 290 | 6,203 |  |
| Other countries | **773 | 32.1 | 64 | 1,782 |  |
| Total foreign | *2,600 | 154.8 | 404 | 10,837 |  |
|  |
- nil or rounded to zero (including null cells)
np not available for publication but included in "Other countries".
* estimate has a relative standard error of between 25% and 50% and should be used with caution.
** estimate has a relative standard error greater than 50% and is considered too unreliable for general use. |
 |  |  |  |  |  |
 |
Industry Value Added by selected Country of Owner, Property and business services, 2000-01
PRIVATE COMMUNITY SERVICES
There was very little foreign involvement in the Private community services industry in 2000-01, with foreign-owned businesses contributing 1% to industry value added (refer to Table 13). The USA and UK were the only significant foreign investors.
Business Activity and Characteristics by Country of Owner, Private community services, 2000-01 |
|  |
 | Operating Businesses | Employment | Gross Fixed Capital Formation | Industry Value Added |  |
 | no. | '000 | $m | $m |  |
|  |
| UK | **68 | 6.3 | 8 | 79 |  |
| USA | *75 | 8.7 | 57 | 245 |  |
| Other countries | 7 | 5.2 | 4 | *-25 |  |
| Total foreign | *150 | 20.2 | 69 | 298 |  |
|  |
* estimate has a relative standard error of between 25% and 50% and should be used with caution.
** estimate has a relative standard error greater than 50% and is considered too unreliable for general use. |
CULTURAL, RECREATIONAL, PERSONAL AND OTHER SERVICES
There was little foreign involvement in the Cultural, recreational, personal and other services industries, with foreign-owned businesses contributing less than 6% of industry value added (refer to Table 14). It was necessary to merge the Cultural and recreational services industry with the Personal and other services industry as the data were dominated by a small number of larger businesses.
Business Activity and Characteristics by Country of Owner, Cultural, recreational, personal and other services, 2000-01 |
|  |
 | Operating Businesses | Employment | Gross Fixed Capital Formation | Industry Value Added |  |
 | no. | '000 | $m | $m |  |
|  |
| USA | *51 | 13.1 | np | 731 |  |
| Other countries | **364 | 8.4 | 765 | *242 |  |
| Total foreign | **415 | 21.5 | 765 | 973 |  |
|  |
np not available for publication but included in "Other countries".
* estimate has a relative standard error of between 25% and 50% and should be used with caution.
** estimate has a relative standard error greater than 50% and is considered too unreliable for general use. |
 Print Page
 Print All