 USING TABLEBUILDER
For general information relating to TableBuilder or instructions on how to use features of the TableBuilder product, please refer to the User Manual: TableBuilder, 2012 (cat. no. 1406.0.55.005).
More specific information relevant to the Participation in Selected Cultural Activities TableBuilder, which should enable users to understand and interpret the data, is outlined below.
COUNTING UNITS AND WEIGHTS
Weighting is the process of adjusting results from a sample survey to infer results for the total population. To do this, a 'weight' is allocated to each person. The weight is the value that indicates how many population units are represented by the sample unit.
The Participation in Selected Cultural Activities TableBuilder can only produce estimates of persons and therefore all tables use a person level weight. This includes tables with data items from the Most Frequent Participation Level. The following image shows the available Summation Options.
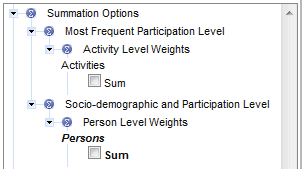
The default weight when producing any table using the Participation in Selected Cultural Activities TableBuilder is the person weight (in bold in the image above). This weight is automatically applied to any table being generated. A weight in bold, such as in the image above, indicates the weight being used in the table. The 'Person level weight' is the only weight that should be used in all tables because information about cultural involvement relates to people. If 'Persons' is not in bold, tick the sum box below the 'Persons' heading.
SELECTING DATA ITEMS FOR CROSS-TABULATION
Apart from the Field Exclusion Rules that are applied in TableBuilder, there are minimal restrictions on the items that can be selected to appear in a table. That is, generally, users are able to cross–tabulate any variable with any other variable on the file. However, often the resulting table is not logical. For example, 'Number of cultural activities participated in in the last 12 months' by 'Whether earned a wage or salary for participation in cultural activity' cross–tabulates an item from the Participation Level with an item from the Most Frequent Participation Level which has no meaningful connection as a cross-tabulation.
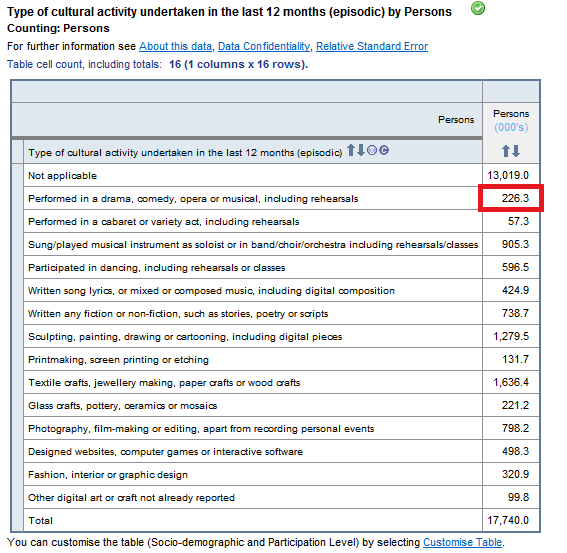
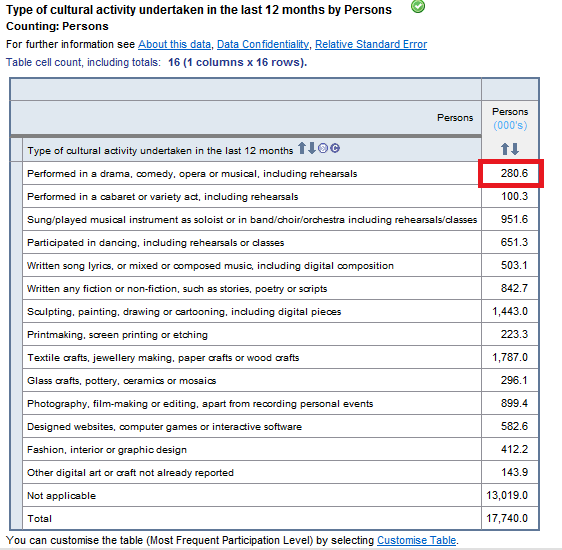
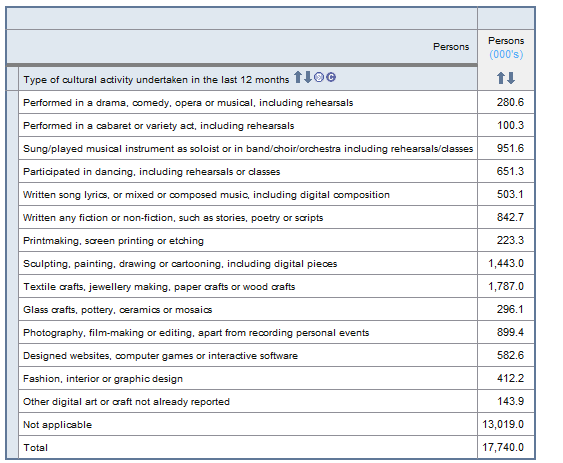
In table 1 below, 226,300 people participated in a drama, comedy, opera or musical when using the Most Frequent Participation Level Data Item. This is lower than the 280,600 figure produced in table 2 where the Participation Level was used. This is because table 1 includes information for up to three activities per person and table 2 includes information for up to 14 activities per person. The figures are different because of the way the survey was designed: respondents were first asked whether they participated in a selection of 14 cultural activities. Then, if they participated in more than three activities, they were asked to nominate the three activities they did the most. More detailed questions were then asked about these three activities such as whether the respondent earned a wage or salary for their cultural participation.
1. USING MOST FREQUENT PARTICIPATION LEVEL DATA ITEM
2. USING PARTICIPATION LEVEL DATA ITEM
To create tables which contain characteristics data for a particular activity or set of different activities, cross–tabulate the Most Frequent Participation Level 'Type of cultural activity undertaken in last 12 months (episodic)' data item with Participation Level characteristic data items, e.g. 'Reasons for participating in cultural activity in last 12 months' or 'Whether earned a wage or salary for participation in cultural activity'. To create a summary table about people's overall involvement in cultural activities, use Participation Level Data Items. For example, using 'Whether (up to three) cultural activities were made available on the internet in last 12 months' will give data regarding whether a person made at least one (and up to three) of their cultural activities available on the internet in the last 12 months.
It is important that the 'Most Frequent Participation Level' data item, 'Type of cultural activity undertaken in last 12 months (episodic)' is not cross–tabulated with 'Participation Level' data items. This tabulation will produce incorrect results.
FIELD EXCLUSION RULES
To ensure confidentiality, TableBuilder prevents the cross–tabulation of certain variables which could result in respondents being identified. These are know as field exclusion rules. If field exclusion rules exist for certain variables, users will see the following message: “Maximum number of fields in exclusion group exceeded.”
TABLE POPULATIONS
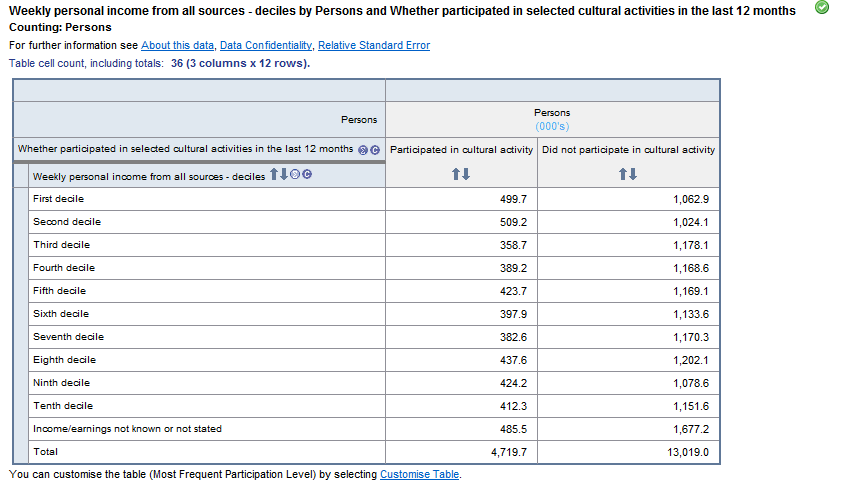
Table populations or units of measure can be found by looking at the 'Counting' subheading (see example below).
ADJUSTMENT OF CELL VALUES
The TableBuilder dataset has random adjustment of cell values applied to avoid the release of identifiable data. All cells in a table are adjusted to prevent any identifiable data being exposed. For this dataset 'additivity' has not been applied, that is, when the interior cells are randomly adjusted they have not been set to add up to the totals. As a result, randomly adjusted individual cells will be consistent across tables, but the totals in any table will not be the sum of the individual cell values.
ZERO VALUE CELLS
Tables generated from sample surveys will sometimes contain cells with zero values because no respondents that satisfy the parameters of the cell were in the survey. This is despite there being people in the population with those characteristics. That is, the cell may have had a value above zero if all persons in scope of the survey had been enumerated. This is an example of sampling variability which occurs with all sample surveys. Relative Standard Errors cannot be generated for zero cells.
MULTI–RESPONSE DATA ITEMS
A number of the survey's data items allow respondents to provide more than one response. These are referred to as 'multi–response data items'. An example of such a data item is pictured below. For this data item respondents can report participating in 14 categories of cultural activities in the last 12 months.

When a multiple response data item is tabulated, a person is counted against each response they have provided (e.g. a person who has performed in a drama, comedy, opera or musical, including rehearsals or has participated in fashion, interior or graphic design will be counted once in each of these two categories).
As a result, each person in the appropriate population is counted at least once, and some persons are counted multiple times. Therefore, the total for a multiple response data item will be less than or equal to the sum of its components. Multi–response data items can be identified by the initials 'MR' in the data item list, which can be accessed from the Downloads page. In the example below, the sum of the components is 22,136,100 whereas the total population is 17,740,000.
NOT APPLICABLE CATEGORIES
Most data items include a 'not applicable' category. The 'not applicable' category comprises those respondents who were not asked a particular question(s) and hence are not applicable to the population to which the data item refers. In the example above, 13,019,000 people did not participate in any other selected cultural activities in the 12 months prior to interview. The classification value of the 'not applicable' category where relevant is shown in the data item list (see the Data Item List in the Downloads tab).
 Print Page
 Print All
 Quality Declaration