INTRODUCTION
This snapshot presents an overview of the health expenditure of households in Australia, focusing on medical care and health costs.
DATA SOURCES
This article is based mainly on data from the 2003–04 Australian Bureau of Statistics (ABS) Household Expenditure Survey (HES) and the 2004–05 ABS National Health Survey (NHS). HES data shows net household costs i.e. out-of-pocket expenditure after Medicare or private health insurance refunds. Data from the HES uses households (footnote 1) as the unit of analysis, so data are presented on a household, rather than an individual basis.
INQUIRIES
For further information about these and related statistics, contact the National Information and Referral Service on 1300 135 070 or email client.services@abs.gov.au.
HEALTH EXPENDITURE
- Health expenditure in Australia includes expenditure funded by the federal as well as state and territory governments, by private health insurance and by individuals and households. Total health expenditure in Australia in 2004–05 was $81 billion or 9.0% of GDP. This equates to $4,001 per person (AIHW 2007).
- Government, both state and federal, funded the majority (68%) of health spending. Individual out-of-pocket payments accounted for just over half (53%) of the remaining $26.2 billion non-government sector funding (AIHW 2007).
HOUSEHOLD HEALTH EXPENDITURE
- According to the 2003–04 HES, in the 12 months to June 2004, Australian households spent $46 per week, on average, on medical care and health expenses. This was approximately 5% of an average household's expenditure on goods and services each week.
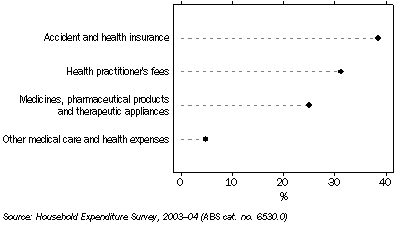
- The main items contributing to the household's overall medical care and health expenditure were accident and health insurance (averaging 39%), health practitioner's fees (31%) and medicines, pharmaceutical products and therapeutic appliances (25%). The remainder was mainly taken up by hospital and nursing home charges.
Distribution of household expenditure on health, 2003–04

- Households spent an average of $18 per week on accident and health insurance in 2003–04. The majority of this was for private health insurance (87%), with the remainder for sickness and personal accident cover (12%) and separate ambulance cover (1%).
- Health practitioner's fees averaged $14 a week and were mainly for dental treatments (40%) and specialist doctor's fees (30%), with fees for general practitioners accounting for 11% of health practitioner's fees, reflecting the higher level of government subsidisation of GP services.
- Although expenditure on GP's fees was comparatively less than other types of doctor's fees, people were more likely to have seen a GP. In the 2004–05 NHS, of persons who reported that they had seen a health practitioner in the last two weeks, a fifth had seen a general practitioner (20%), while dentists, specialists and other health professionals (footnote 2) accounted for 6%, 5% and 13% respectively.
- Some Australians choose to take out ancillary cover with a private health insurer to recover some of their health expenses on dental care and the services of other health professionals. In 2004–05 24% of people aged 15 years and over with ancillary cover had consulted a dentist or other health professional in the previous two weeks, compared with 16% of those who did not have ancillary cover (after adjusting for age differences).
- Of the $5.1 billion spent on dental services in 2004–05, the majority (67%) was paid for by individuals. Private health insurance funds contributed around 14% (AIHW 2007).
Household health expenditure on health practitioner's fees, 2003–04
- As a proportion of total household expenditure on goods and services, health expenditure rose from 3.9% in 1984 to 5.1% in 2003–04.
- The proportion of total household expenditure on health and accident insurance decreased from 40.6% in 1998–99 to 38.6% in 2003–04, while the corresponding expenditure on health practitioner's fees and medicines, pharmaceutical products and therapeutic appliances remained relatively unchanged over this five year period.
GOVERNMENT HEALTH CARDS AND PRIVATE HEALTH INSURANCE
- For people with low incomes or who meet other criteria, eligibility for a government health card (footnote 3) results in a significant reduction in their out-of-pocket expenses on health; they are entitled to medical care or hospital treatment as well as medicine free of charge or at reduced rates.
- According to the 2004–05 NHS, 35% of persons 15 years and over were covered by a government health card.
- Another option to offset health expenses available to all Australians is through contributions to a private health insurance scheme. Depending on the type of cover purchased, private health insurance provides cover against all or part of operation and accommodation expenses in public or private hospitals, as well as ambulance cover and expenses for a range of services not covered under Medicare.
- In the 2004–05 NHS, more than half of Australians aged 15 years and over were covered by some form of private health insurance.
- The NHS also showed that the most commonly reported reason for not having private health insurance, across all age and income groups, was because they could not afford it or it was too expensive (64%).
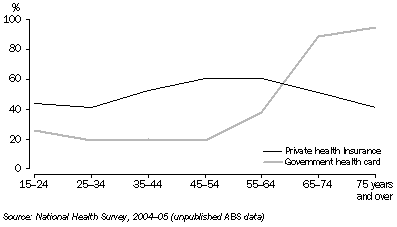
- People aged 25–34 years and 75 years and over were the least likely to have private health insurance (41%). The 25–34 year age group were also one of the least likely to be covered by a government health card (19%) whereas nearly all (95%) of the older age group were covered by a government health card.
Persons with private health insurance and government health cards, 2004–05

HOSPITAL COSTS
- In 2004–05, 20% of people (15 years and over) with private hospital insurance who were admitted to hospital in the previous 12 months reported their most recent admission had been made as a public (Medicare) patient.
- Average out-of-pocket costs in 2005–06 for patients with hospital cover ranged from $35 per person aged 15–19 years to $240 for persons aged 65–84 years (AIHW 2007).
- On average, out-of-pocket costs were higher for females than for males with similar types of cover in the 15–64 years age group. In the 20–44 years age group, the out-of-pocket expenditure for females with hospital cover was more than twice the rate of males (AIHW 2007).
HOUSEHOLD CHARACTERISTICS
- Differences in household expenditure on health across households are often related to the age structures and/or income. Health costs as a proportion of total household expenditure on goods and services tend to be higher in households with older people.
- Couple only households where the reference person (footnote 4) was aged under 35 spent 3.3% of total goods and services expenditure on medical care and health expenses in 2003–04, while couple only households where the reference person was aged 65 and over spent 7.7%. A lone person aged 65 and over spent the highest proportion of expenditure on health 8.8%, while a person aged under 35 years living alone had the lowest proportional expenditure of any household group (2.4%).
- One parent with dependent children households also spent a comparatively low proportion (3.2%) of their total expenditure on health.
Weekly household expenditure on health by selected life cycle groups, 2003–04
INCOME
- Despite different incomes, households spend on average the same proportion (5%) of their disposable income on medical care and health expenses. This may reflect Australian government assistance for low income earners and other pension recipients by providing government health cards for those eligible and various safety net arrangements for patient-billed out-of-hospital services, resulting in subsidised medical costs.
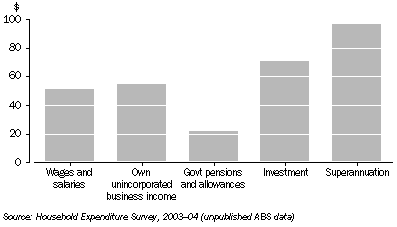
- In 2003–04, households whose main source of income was from superannuation had the highest expenditure on health, reflecting the higher number of older people in these households, whose income was such that they were not eligible for a health concession card.
- Households in the low income group (footnote 5) in 2003–04 spent an average of $28 per week on medical care and health expenses, compared with $68 per week spent by households in the highest income group. However, health and medical expenses as a proportion of total goods and services expenditure were around 5% for households in both groups.
- The proportion of expenditure spent on health items also varied across income groups. Those in low income households used 35% of their health expenditure on health insurance, 32% on health practitioner's fees and 31% on medicines and pharmaceutical products. In comparison, households in the highest household income group used 44%, 34% and 21% for the same expenditure groups, respectively.
- In the 2004–05 NHS, 87% of persons aged 15 years and over in the lowest quintile of gross household income (footnote 6) had a health concession card, in contrast to 5% of those in the highest quintile. However, 29% of the lowest gross income quintile had private health insurance, in contrast to 76% of persons aged 15 years and over in the highest gross household income quintile.
Household expenditure on health by principal source of gross household income, 2003–04

REGIONAL DIFFERENCES
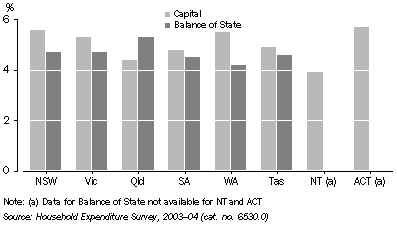
- In 2003–04 households in the Northern Territory reported the lowest proportion of household health expenditure (3.8%), while households in the ACT (5.7%) reported the highest proportion of total expenditure on health, partly reflecting the age and income profiles in the two territories.
- While the national trend was for households in capital cities to spend a higher proportion of their income on health expenses than households in the balance of their states, the exception was Queensland, where households in Brisbane spent 4.4% of their income, compared to an average of 5.3% for households in the rest of Queensland.
- The distribution of health expenditure items also differed between capital cities. Households in Hobart spent 21% of their household health expenditure on health practitioner's fees, while households in Canberra spent 44%. Households in Sydney reported the highest household expenditure on medicines, pharmaceuticals and therapeutic aids (29% of health expenditure).
- Households in Hobart spent 54% of their household health expenditure on health insurance in 2003–04. In the 2004–05 NHS, an estimated 63% of persons aged 15 years and over living in Hobart had private health insurance, the highest percentage of persons with private health insurance in any capital city of Australia.
Household expenditure on health by state, 2003–04

FOOTNOTES
1.
Household – A person living alone or a group of related or unrelated people who usually live in the same private dwelling.
2.
Other health professionals – Audiologist/audiometrist, Chiropractor, Clinical Psychologist, Dietitian, Massage Therapist, Occupational therapist, Osteopath, Physiotherapist, Podiatrist or Speech therapist.
3.
Government health card – Refers to coverage by the following government-issued cards which entitle the card holder, and in some cases their dependents, to a variety of health benefits or concessions (e.g. medical care, hospital treatment/accommodation, supply of pharmaceuticals, free of charge or at reduced rates):
- any cards from the Department of Veterans' Affairs (DVA);
- Health Care Card (including the low income health care card);
- Pensioner Concession Card;
Commonwealth Seniors Health Card.
4.
Reference Person – The reference person for each household is chosen by applying, to all household members aged 15 years and over, the selection criteria below, in the order listed, until a single appropriate reference person is identified:
one of the partners in a registered or de facto marriage, with dependent children
one of the partners in a registered or de facto marriage, without dependent children
a lone parent with dependent children
the person with the highest income
the eldest person.
For example, in a household containing a lone parent with a non-dependant child, the one with the higher income will become the reference person. However, if both individuals have the same income, the elder will become the reference person.
5.
Low income group – Households containing the 20% of people with equivalised disposable household income in the second and third deciles. Households containing people with equivalised disposable household income in the lowest decile are not included as income does not provide a useful indicator of well-being for many of these households.
Equivalised disposable household income is disposable household income (gross household income less income tax and the medicare levy) adjusted for household size using an equivalence scale. For a lone person household it is equal to disposable household income. For a household comprising more than one person, it is an indicator of the disposable household income that would need to be received by a lone person household to enjoy the same level of economic well-being as the household in question.
6.
Gross household income quintile – Groupings that result from ranking all households or people in the population in ascending order according to their gross household income and then dividing the population into five equal groups, each comprising 20% of households.
Gross household income is calculated from regular cash receipts before income tax or the Medicare levy are deducted.
REFERENCES
Australian Bureau of Statistics (2006)
Household Expenditure Survey, Australia: Summary of Results, 2003–04 (Reissue) (cat. no. 6530.0) ABS, Canberra.
Australian Bureau of Statistics (2006)
National Health Survey: Summary of Results, Australia, 2004–05 (cat. no. 4364.0) ABS, Canberra.
Australian Institute of Health and Welfare (2007), Health expenditure Australia 2005–06, (cat. no. HWE 37; Health and Welfare Expenditure Series No. 30), AIHW, Canberra.
 Print Page
 Print All
 Quality Declaration