 Quality Declaration
Page tools:
 Print Page Print Page
 Print All Print All
| |||||||||
MAIN FINDINGS Decisions by governments, businesses and individuals taken in areas such as water use and conservation; energy production and use; and control of emissions of greenhouse gases, all impact on the environment and the socio-economy. This publication presents data produced in accordance with the System of Environmental-Economic Accounting, an international statistical standard that is consistent with the System of National Accounts and which governs the reporting of integrated socio-economic and environmental information. This system strengthens the basis of decision-making needed to reflect the scientific, economic and social dimensions of many important issues facing the Australian community. INTEGRATED SOCIOECONOMIC AND ENVIRONMENTAL INDICATORS Australia's measure of economic production (Gross Value Added) in chain volume terms, rose 28% over the period 2006-07 to 2015-16 (Figure 1). Over the same period, Australia's population increased 16%; Australian energy consumption increased 6%; and waste generation increased 23% (to 2014-15). Relative to 2006-07, Australian greenhouse gas emissions decreased by 13%, and water consumption decreased by 2%. Figure 1 shows these changes relative to 2006-07 as an index. It can be seen that, since 2006-07, the economy (measured by Gross Value Added) has been growing at a faster rate than both the population, and all the presented environmental consumption indicators. More recently, between 2014-15 and 2015-16, the economy grew by 3%. At the same time, the population increased 2%; greenhouse gas emissions were up just under 1%; and Australian energy consumption increased less than 1%. Water consumption decreased 7% between these years (Table 1).  Annotation(s): Index: 2006-07 = 100 Footnote(s): (a) Greenhouse gas emissions are for Australian territory only; (b) Time series runs to 2014-15. If the economy is growing at a faster rate than the consumption of our resources (or generation of waste and emissions), it is an indication that we are using our resources more efficiently, as measured by the Gross Value Added (GVA) of economic production per unit of resource use (or waste generated). Figure 2 shows measures of intensity for: water consumption; energy consumption; greenhouse gas emissions; and waste generated. Relative to 2006-07, Australia's greenhouse gas emissions intensity, energy intensity, water intensity, and waste intensity have all declined. That is, less water and energy is being used, and less waste and greenhouse gases are being generated, to create the same amount of economic output. Water use intensity has dropped 24%, greenhouse gas emissions intensity has dropped 32%, while energy intensity has dropped 17%, and waste intensity (to 2014-15) has dropped 2%. All measures continued to show a reduction in intensity between 2014-15 and 2015-16 (Figure 2). 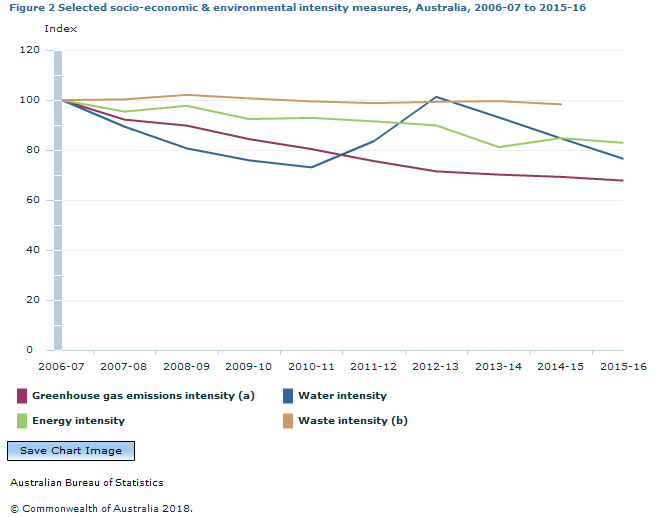 Annotation(s): Index: 2006-07 = 100 Footnote(s): (a) Greenhouse gas emissions are for Australian territory only; (b) Time series runs to 2014-15. INDICATORS OF ENVIRONMENTAL PRESSURE FOR SELECTED INDUSTRIES Mining Figure 3 shows selected economic and environmental measures for the Mining industry, measured as an index relative to 2002-03. The value of mining production, as measured by GVA, increased 98% between 2002-03 and 2015-16 (Figure 3). Over the same period, energy use by the mining industry increased 262%, mainly due to large increases in the use of natural gas for transformation. Greenhouse gas emissions increased 56%, and water consumption increased 16% over this period (although water consumption has dropped 14% between 2014-15 and 2015-16). 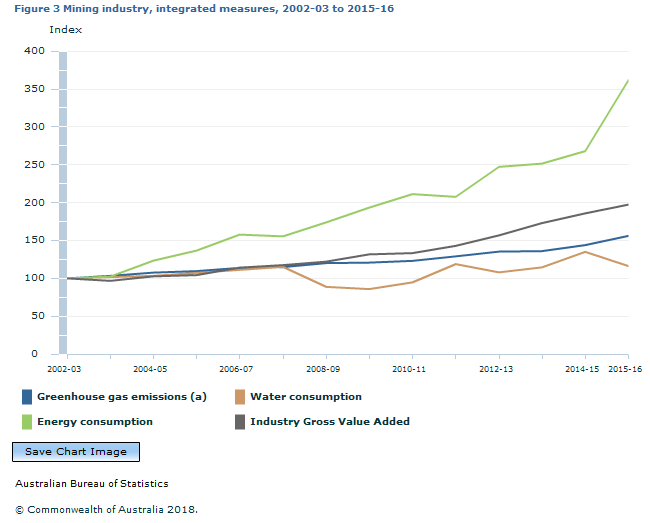 Annotation(s): Index: 2002-03 = 100 Footnote(s): (a) Greenhouse gas emissions are for Australian territory only. Agriculture The value of production generated by the agriculture industry (including forestry and fishing), as measured by GVA, increased 43% between 2002-03 and 2015-16 (Figure 4). Over this period agricultural energy use increased 46%, while greenhouse gas emissions reduced by 59%, and water consumption declined 29%. The decline in water consumption largely occurred over the drought period between 2005-06 and 2010-11. All measures showed decreases between 2014-15 and 2015-16. 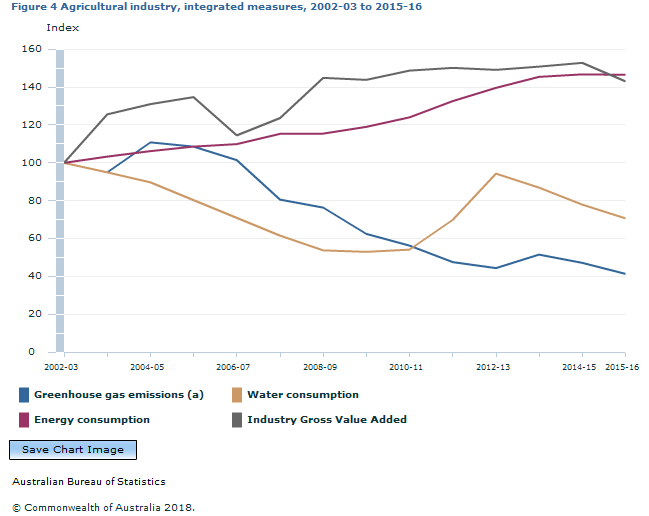 Annotation(s): Index: 2002-03 = 100 Footnote(s): (a) Greenhouse gas emissions are for Australian territory only. Total gross value of irrigated agricultural production (GVIAP), excluding forestry and fishing, for Australia in 2015-16 was $15.0b, up 26% from 2008-09. The three commodities with the highest GVIAP in 2015-16 were fruit and nuts ($3.8b, up 59% from 2008-09), vegetables ($2.8b, up 7% from 2008-09 and dairy production ($2.1b, down 8% from 2008-09) (Table 3). Manufacturing Manufacturing production, as measured by GVA, fell 7% between 2002-03 and 2015-16 (Figure 5). Over this period, energy consumption dropped 20% and greenhouse gas emissions decreased 19%. Water consumption was fairly consistent (1% increase over this period). 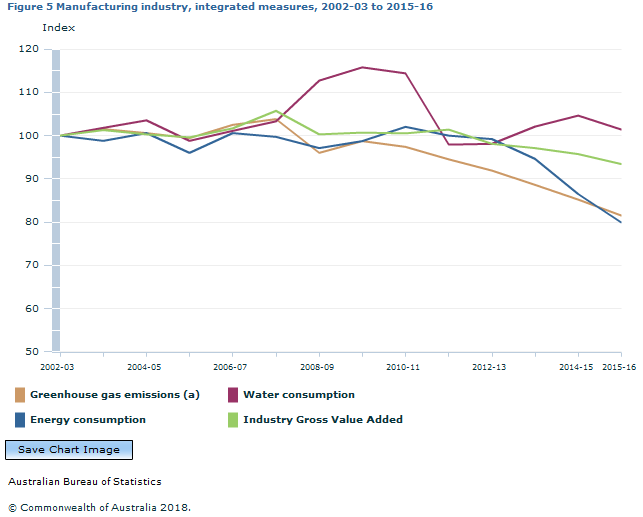 Annotation(s): Index: 2002-03 = 100 Footnote(s): (a) Greenhouse gas emissions are for Australian territory only. ENVIRONMENTAL ASSETS The notion of environmental assets used in this publication is consistent with the System of Environmental-Economic Accounting 2012 (SEEA) definition and can include: subsoil assets, both mineral and energy; land; soil resources; timber resources, both plantation and native forest; aquatic resources (e.g. fish), both cultivated and natural; water resources, comprising surface water, ground water and soil water; and other biological resources. The Australian Bureau of Statistics (ABS) produces estimates of the value of subsoil, land and timber assets. While the ABS does not separately identify the value of water resources on the national balance sheet, ABS research in this area is described in a recent feature article Experimental estimates of the value of water resource stocks, Australia, Australian Environmental-Economic Accounts, 2016 (cat. no. 4655.0). The value of Australia’s environmental assets in 2016-17 was $6,412.8b (in current prices), an increase of 10% on 2015-16 (Figure 6). This compares with Australia's produced capital, which was valued at $5,943.4b in 2016-17, an increase of 4% on 2015-16. 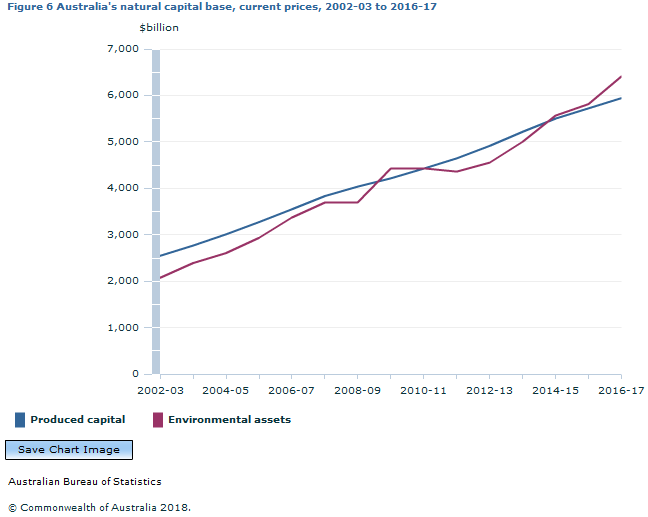 Figure 7 breaks down Australia's environmental assets into type of asset. In 2016-17, land accounted for 90% of the total value of Australia's environmental assets, and it's value continues to grow at a faster rate than the other environmental assets (mineral, energy and timber), with an 11% increase on 2015-16. Since 2006-07, land assets have increased in value by 86%; mineral assets increased by 232% (to $398.2b in 2016-17); energy assets increased by 63%; and timber increased by 10%. 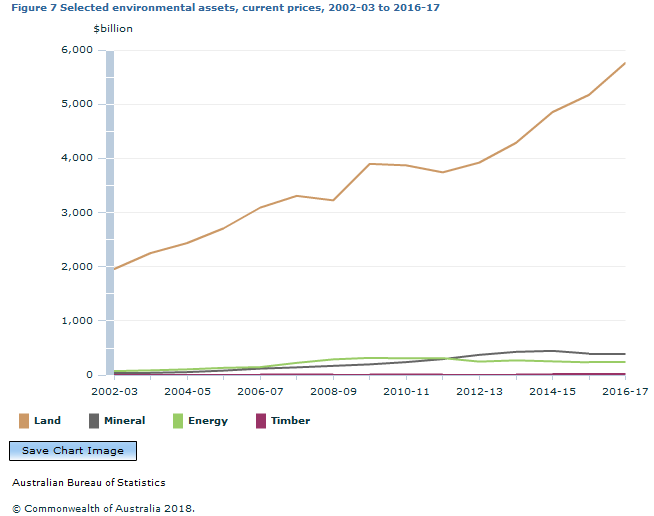 Mineral and energy resources Figure 8 presents the value of selected mineral and energy resources from 2005-06 to 2016-17. These are economic demonstrated resources that are judged to be economically extractable. The quantity and quality are computed partly from specific measurements and partly by extrapolating from geological evidence. Since 2010-11, the value of both natural gas and iron ore (the highest-value assets) have more than doubled in value (to $183.5b and $243.9b, respectively). Over the same period, crude oil, condensate, and black coal all decreased in value.  WATER SUPPLY, USE AND CONSUMPTION Water consumption Figure 9 shows water consumption by Australian industry and households from 2008-09 to 2015-16. Total water consumption in 2015-16 was 16,132 gigalitres, an increase of 15% over that period. Agriculture (including forestry and fishing) consumed 60% of Australia's total water consumption, and recorded an overall 31% increase in water consumption since 2008-09 (total 9,604 gigalitres in 2015-16), peaking in 2012-13 with 12,809 gigalitres of water consumed in that year. This followed the end of the millenial drought, with a low of 7,204 gigalitres consumed by agriculture, forestry and fishing in 2009-10. More recently, between 2014-15 and 2015-16 there was an overall decrease of just over 7%, primarily driven by reduced water consumption by the agriculture industry. All industries showed a decrease since 2014-15, with households showing a slight (less than 3%) increase.  and households, 2008-09 to 2015-16.GIF) Footnote(s): (a) Water consumption by industry = Self-extracted use + Distributed water use + Reuse water use - In-stream water use - Distributed water supplied to other users. Household water use and expenditure Households consumed 12% of total water consumption in 2015-16, with an overall 4% increase in their water use since 2008-09. By contrast, over the same period, the number of households in Australia increased 14%, and household expenditure on water increased 82%, from $2,966m in 2008-09 to $5,406m in 2015-16. The rate in growth in both consumption and expenditure have slowed over recent years (Figure 10). 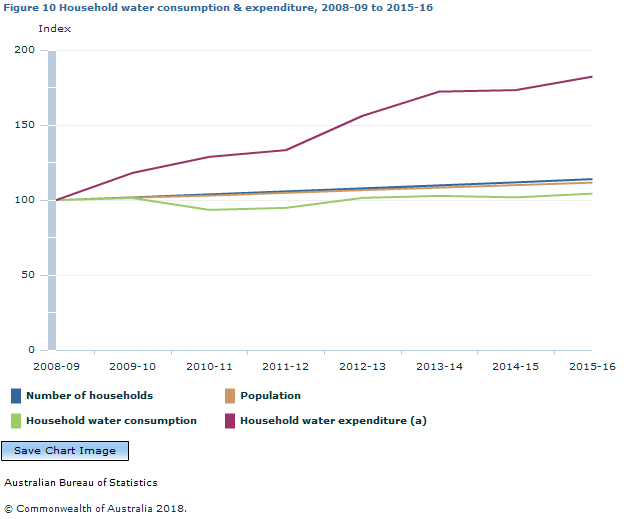 Annotation(s): Index: 2008-09 = 100 Footnote(s): (a) Distributed and reuse water. Expenditure on water and related services, 2008-09 to 2015-16 Of the $17,094m spent by Australian industry and households on water and related services in 2015-16, 59% of this expenditure was by households. Although a much smaller share of total water-related expenditure, each of Agriculture, forestry and fishing; Mining; and Electricity, gas, water and waste services also showed growth in expenditure between 2008-09 and 2015-16 (Figure 11). Most industries, as well as households, have shown a slowing in the growth of water-related expenditures in recent times (between 2014-15 and 2015-16), except for Manufacturing which had a 19% increase in water expenditure, and Electricity, gas, water and waste services which experienced a 7% increase. , 2008-09 to 2015-16.GIF) Figure 12 compares water use (distributed and reuse water only) and expenditure for selected industries and households, for the most recent year, 2015-16. Agriculture (including forestry and fishing) used 53% of total distributed and reuse water, and their expenditure comprised 8% of total Australian expenditure on distributed and reuse water. Australian households, on the other hand, consumed 16% of total distributed and reuse water in Australia, while making up 62% of all expenditure on distributed and reuse water. All other industries (excluding Agriculture, forestry and fishing) contributed around 30% of both water use and water expenditure. A driver for this difference is that Australian households pay a premium for high quality (potable) drinking water, relative to larger quantities of lower quality (non-potable) water used by Agriculture and other industries. , percentage contribution to total, 2015-16.GIF) Footnote(s): (a) Distributed and reuse water; (b) Includes Mining, Manufacturing, Electricity, gas, water and waste services and Other industries. Between 2008-09 and 2015-16, distributed and reuse water use by Agriculture, forestry and fishing increased 57%, while expenditure on these water products increased 71%. Over the same period, household use of distributed and reuse water increased 8%, while expenditure increased 82%, with the largest increases occurring between 2008-09 and 2009-10, and 2011-12 and 2012-13. For all other (non-agricultural) industries, distributed and reuse water use decreased (by 13%), while expenditure increased 43% (Table 3). ENERGY SUPPLY AND USE Supply of energy Total Australian supply of energy includes: direct extraction of natural resources; total amount of secondary energy produced; imports; and residuals. Total supply of energy for Australia in 2015-16 was 29,381 petajoules, a 36% increase since 2002-03. Figure 13 presents energy supply broken into its various broad-level components (excludes residuals). Just under three-quarters (72%, 21,111 petajoules) of total supply is comprised of direct extraction of natural resources, with well over half of this (58% in 2015-16) being black coal (Table 4). This component of supply (direct extraction) has increased 36% between 2002-03 and 2015-16, as has supply due to secondary production. This increase in secondary production of energy is driven largely by an increase in Liquified natural gas (LNG). Over the same period, imports have increased 67%, up to 2,132 petajoules in 2015-16. Overall, black coal comprised 41% of total energy supply (12,157 petajoules), an increase of 67% since 2002-03. Natural gas was 12% (3,647 petajoules) of total supply, an increase of 149% on 2002-03. Natural gas and LNG were the two products to show the largest increases in energy supply between 2014-15 and 2015-16, with increases of 26% and 46%, respectively (Table 4).  Footnote(s): (a) Primary energy products, including renewables; (b) Excludes residuals. Use of energy Total energy use for Australia includes: Australian industry use - both energy used for transformation into secondary energy products and energy end use; household use; exports; and residuals. Figure 14 shows energy use by industry, households and exports since 2002-03 (excluding residuals). In 2015-16, exports comprised 59% of total energy use (17,388 petajoules), an increase of 47% since 2002-03. Energy use by mining showed a large 262% increase since 2002-03 (up to 2,807 petajoules in 2015-16), including a 35% increase since 2014-15, (primarily due to an increase in natural gas which is used to produce LNG) (Table 4). Manufacturing energy use continued to decrease in 2015-16 (20% decline since 2002-03, and 8% decline from 2014-15). All other industries (excludes electricity, gas, water and waste services) energy use has remained fairly constant since 2012-13 (1,033 petajoules in 2015-16). Household energy use has shown a 19% increase since 2002-03 (to 1,299 petajoules in 2015-16), with a small 1% increase on 2014-15.  by industry, households and exports, 2002-03 to 2015-16.GIF) Footnote(s): (a) Energy use by industry = End use + Transformation of energy products. Figure 15 shows energy use by Australian industry and households from 2002-03 to 2015-16, by selected energy products. Energy exports are shown separately in Figure 16. Total Australian use, excluding exports and inventory changes, was 12,181 petajoules in 2015-16, a 23% increase from 2002-03, and a 6% increase on 2014-15. The largest use, by product, was for natural gas (3,528 petajoules), 29% of total Australian use (excluding exports), which showed a 157% increase in use since 2002-03, and 25% increase on 2014-15. As mentioned above, much of this increase is due to increased use of natural gas by Mining over this period. The use of black coal has declined since 2002-03 (-7%), but with a 6% increase (to 1,327 petajoules) from 2014-15 to 2015-16. The use of crude oil and feedstock continues to decline (11% decrease on 2014-15), and is now matched by diesel use, which has seen a 71% increase since 2002-03. Renewables have shown a 31% increase since 2002-03 - and a 4% increase since 2014-15 - off a low base. Electricity consumption has increased for the second year in a row (to 920 petajoules in 2015-16), following a gradual decline since it peaked in 2010-11. , by selected energy products, 2002-03 to 2015-16.GIF) Footnote(s): (a) Includes both energy used for production of secondary energy products, and energy end use by industry. Excludes Exports and residuals. Black coal makes up 63% of Australia's energy exports (11,001 petajoules in 2015-16). Exports of black coal have increased 86% since 2002-03, although showed a slight decline between 2014-15 and 2015-16. Uranium exports accounted for 21% of Australian energy exports in 2015-16, a 42% jump from 2014-15. LNG exports (2,025 petajoules in 2015-16) showed the largest growth in exports - a 375% increase since 2002-03, and a 46% increase since 2014-15. This is consistent with increased production of LNG by the mining industry over this period.  Figure 17 shows the monetary value of selected energy products from 2008-09 to 2015-16. At $57,194m, petroleum products were the highest-valued product in 2015-16, although these products experienced a drop of 9% between 2014-15 and 2015-16. Gas and electricity generation both recorded large increases in value between 2008-09 and 2015-16, at 45% and 56% respectively. Both showed modest increases between 2014-15 and 2015-16. Oil continued to decline, with a 41% drop between 2014-15 and 2015-16. 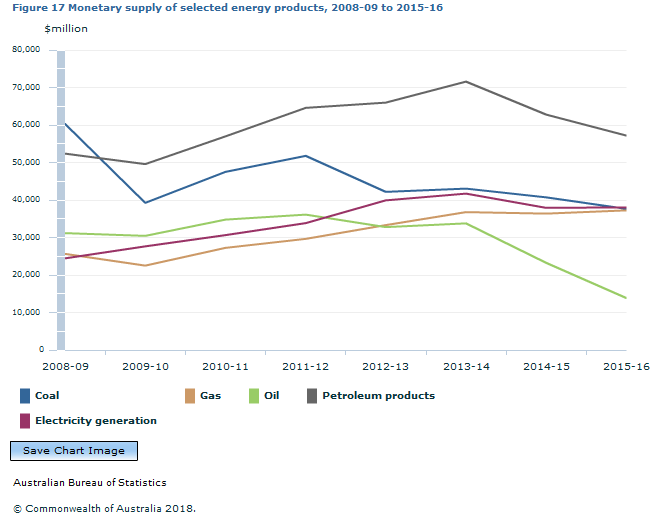 GREENHOUSE GAS EMISSIONS Estimates of direct greenhouse (GHG) emissions in Figure 18 are recorded on a SEEA basis i.e. on a residence basis. SEEA based modifications for the residence principle include extending the geographic boundary of a country to cover activities of economic units resident in Australia and their international activities. The residence basis allows full comparability with standard economic statistics but differs somewhat from the territory basis. The territory basis underpins estimates of GHG emissions produced in accordance with the United Nations Framework Convention on Climate Change (UNFCCC). Between 2004-05 and 2015-16 total direct GHG emissions by Australia measured on a SEEA basis fell by 12%, from 620.2Mt of CO2 equivalent GHG emissions to 546.7Mt. This decline is mainly due to the agriculture industry (including forestry and fishing) which recorded a 63% fall in emissions over this period, down to 64.3Mt in 2015-16, due to less livestock and consequently less enteric fermentation over this time. The manufacturing industry also recorded a reduction in GHG emissions between 2004-05 and 2015-16 (19%, down to 60.0 Mt in 2015-16). Both Mining and all Other industries experienced a growth in GHG emissions over this period (45% and 21%, respectively), while the Electricity, gas, water and waste services industry stayed fairly constant over this period, with a small increase (3%) between 2014-15 and 2015-16 (Figure 18). , selected industries and households, 2004-05 to 2015-16.GIF) Footnote(s): (a) SEEA basis Figure 19 shows the change in each industry (and households) contribution to Australia's GHG emissions (on a SEEA basis), between 2010-11 and 2015-16. Electricity, gas, water and waste services contribute the most to Australia's direct GHG emissions (37% in 2015-16, after a small dip in 2013-14). The largest shifts occurred in Agriculture, forestry and fishing, in which emissions dropped from 16% of total emissions in 2010-11 to 12% of emissions in 2015-16, while Mining emissions increased from 12% in 2010-11 to 15% in 2015-16. In the rest of the economy, Manufacturing share of GHG emissions has been slowly decreasing, and other industries and Households have been showing gradual increases in their share of total direct GHG emissions. , percentage contribution to total by Industry and households, 2010-11 to 2015-16.GIF) Footnote(s): (a) SEEA basis; (b) Includes Forestry and Fishing; (c) Includes Gas, Water and Waste services. ENVIRONMENTAL TAXES Figures 20 and 21 present selected environmental taxes paid by Australian businesses and households, where available, by type of tax. The largest contributor to environmental taxes, by type of tax, is excise duty on crude oil and liquefied petroleum gas (LPG), $17,965m in 2015-16. This is a 33% increase since 2003-04. Stamp duty on vehicle registration amounted to $2,739m in 2015-16, an increase of 45% since 2003-04. Other motor vehicle taxes totalled $7,164m in 2015-16, a 121% increase on 2003-04. In 2015-16, the amount paid for renewable energy certificates (RECs) was $2,157m. Renewable energy targets (RETs) create a legal requirement for liable entities (typically electricity retailers) to purchase a set number of RECs and the observed changes in RECs is due directly to changes to the schedule of RETs (Figure 20). 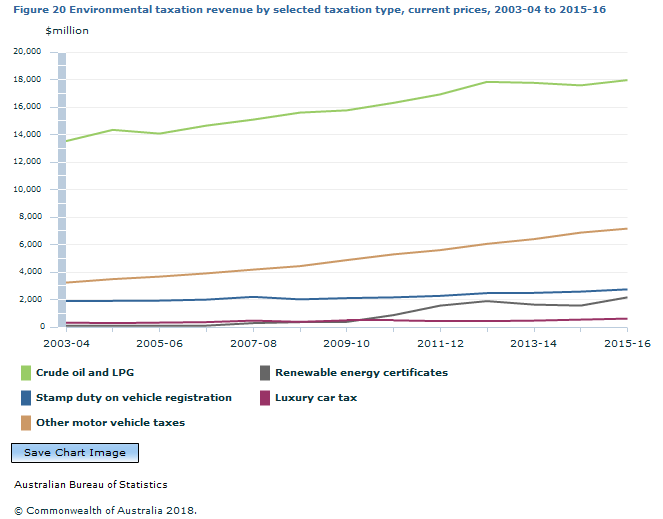 Environmental taxes paid by industry and households Figure 21 includes taxes raised from the Carbon Pricing Mechanism - $6.5b in 2012-13 and $6.9b in its second and final year of operation (2013-14), so numbers for those years are impacted by the introduction of the Carbon Pricing Mechanism for those two years. The scheme required entities which emitted over 25,000 tonnes per year of carbon dioxide equivalent greenhouse gases and which were not in the transport or agriculture sectors to obtain emissions permits. Overall, total environmental taxes increased 65% between 2003-04 and 2015-16 (from $19,085m to $31,503m). The largest increases were in the Electricity, gas, water and waste services industry (over 1,000%), due to RECs payments. Households experienced one of the smallest increase in environmental taxes paid over this period, with an increase of 36%. Only Manufacturing had a smaller increase, with a 13% increase (up to $886m in 2015-16). Figure 21 shows the share of environmental taxes paid by industry and households between 2010-11 and 2015-16. The share of total environmental taxes paid by households was 40% in 2015-16 ($12,686m), down from 42% in 2010-11, after a low of 33% in 2012-13 and 2013-14. The rise in households' share of total environmental taxes in 2014-15 is due to the abolition of the Carbon Pricing Mechanism, which was only levied on businesses. The share of environmental taxes paid by the Electricity, gas, water and waste services industry peaked at 19% and 18% in 2012-13 and 2013-14, respectively. Their share of taxes paid dropped back to 7% in 2014-15 following the abolition of the Carbon Pricing Mechanism, and was 9% in 2015-16. The share of taxes paid by Other industries (mainly service industries) followed a similar trend to households between 2010-11 and 2015-15. In 2015-16 these industries (as a group) contributed nearly one third (32%) of total environmental taxes ($10,208m).  Footnote(s): (a) Includes Forestry and Fishing; (b) Includes Gas, Water and Waste services. Document Selection These documents will be presented in a new window.
|
|||||||||
