|
|
INTRODUCTION
Australia's Environment: Issues and Trends 2003 is the sixth general publication about Australia's environment produced by the Australian Bureau of Statistics. It presents a wide range of information on Australia's Environment and includes information collected by the Australian Bureau of Statistics as well as information collected by others. Its intended role is as a source of statistical information about major aspects of Australia's environment and in particular provides data relevant to the emerging discipline of sustainable development.
The 2003 edition looks in particular at the economic and other values that can be placed on Australia's environment and natural resources. Chapter 1 explores how economic, social and environmental changes and conditions can be measured. It also shows how the System of National Accounts has been used to measure natural resources. Subsequent chapters deal with the economic aspects and environmental impacts of the agriculture, forestry and mining industries, the industries that rely most heavily on direct inputs from the environment. The final chapter addresses waste and waste management in Australia. The publication does not aim to present data on all environmental issues and other topics will be covered in future editions of this publication.
CHAPTER 1. MEASURING ENVIRONMENTAL VALUES, CHANGES AND CONDITIONS
‘Measuring’ the environment, and the changes to it, is a complex task. Measurement is needed, however, to determine whether the quality and quantity of Australia’s natural resources and environmental assets are improving or declining, and whether actions undertaken to safeguard the environment are working effectively. A key part of the challenge is to define and determine exactly what features and values of the environment are of interest and how these might be integrated into our decision-making processes.
A key tension for decision-makers is to balance the economic value of a potentially resource-degrading activity against any other values that the resource might have. This chapter looks at a number of the ways in which Australia’s natural resources and environmental assets are being measured or valued — in both monetary and non-financial terms.
The chapter provides a guide to the relevant issues and an introduction to work being undertaken both within Australia and overseas. Included are discussions of the main measurement frameworks (the System of National Accounts (SNA) and its extensions covering gross domestic product (GDP), the national balance sheet and natural resource accounting), a range of environmental indicators, and techniques to measure the use of natural resources.
Selected statistics from the chapter
- In 1997-98 the electricity supply industry accounted for almost half of the total greenhouse gas emissions expressed as carbon dioxide equivalents (169,000 Gg CO2-e). The manufacturing industry accounted for 17% of all emissions and households were the third highest emitter of greenhouse gases (13% of the total).
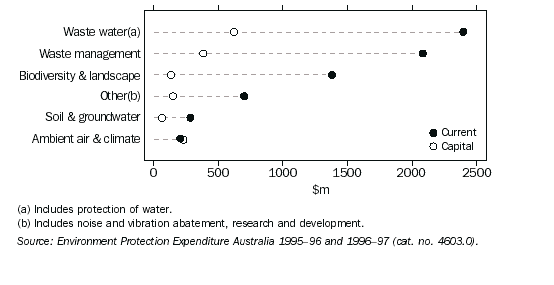
- Most environmental protection expenditure in 1996-97 was made in wastewater management ($3.0b) and waste management activities ($2.5b), compared to protection of biodiversity and landscape ($1.5b), air and climate ($0.5b), and soil and groundwater ($0.3b).
ENVIRONMENTAL PROTECTION EXPENDITURE, By domain - 1996-97
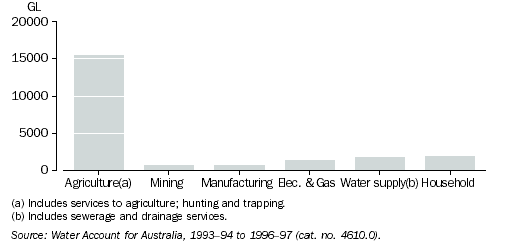
- In 1996-97, Australia had a net consumption of 22,000 GL of water, an increase of 19% from 1993-94. The agricultural industry is by far the largest consumer of water in Australia (15,500 GL or 70% in 1996-97). Other industries including construction and mining, households, manufacturing, and forestry consume the remaining 6,700 GL (30%).
NET WATER CONSUMPTION, By sector - 1996-97
CHAPTER 2. AGRICULTURE AND THE ENVIRONMENT
Agriculture is an important part of the Australian economy. In 1999–2000 the gross value of agricultural production was over $30b, and the sector provided jobs for around 319,000 people on some 146,000 farms, while rural exports (including meat, cereals and their preparations and wool) made up $23.6b worth of exported goods. Furthers details of agricultural production and the contribution of this industry to the economy can be found in Agriculture, Australia (cat. no. 7113.0).
As for other industry activities, agricultural activity has a range of environmental consequences. The impacts of the agricultural sector can be seen particularly through its use of land and water. Agriculture is the largest user of land and water in Australia. Around 456 million hectares (ha), some 60% of the Australian landmass, were used for agriculture in 1999–2000; in 1996–97, the latest year for which data are available, agriculture used some 15,500 gigalitres (GL) of water, or 70% of total water used.
This chapter examines aspects of Australian agriculture and its environmental impacts. It focuses on the period 1990 to 2000, which saw substantial changes in the agricultural sector. Agricultural practices changed in response to market forces, increased awareness of land degradation and a recognition of the need to reduce the impact of agriculture on the environment. A significant change has been a substantial growth in the amount of land devoted to crops; this has led to increases in the use of energy, water, fertilisers and other farm chemicals. The environmental implications of these changes are important. For example, increases in the use of fertiliser can sometimes contribute to water pollution and the incidence of algal blooms, and some farm chemicals are linked to human health risks. The chapter also addresses land degradation.
Selected statistics from the chapter
- In 2000 Australia had 3.2 million ha of saline soils, 109.2 million ha of sodic soils and 21.3 million ha of acidic soils. These three types of degraded soils cost Australian agriculture $187m, $1,035m and $1,585m respectively.
- According to the Australian Greenhouse Office (2001), native vegetation clearing rates have increased from 337,000 ha per year from 1991-95 to 424,000 ha per year from 1996-99.
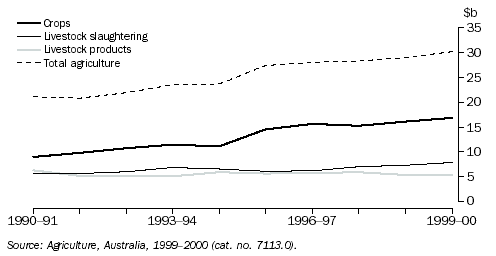
- The volume and value of agricultural production increased from 1990–2000. The increase in value was largely due to the increase in crop volume produced.
VOLUME OF AUSTRALIAN FARM PRODUCTION
 GROSS VALUE OF AGRICULTURAL PRODUCTION, Current prices
- World-wide, four Genetically Modified crops are grown on a large scale: soya beans, canola, corn and cotton. In the year 2000, collectively these covered 44 million ha (16%) of the 271 million ha planted (conventionally and Genetically Modified) to these crops (James 2001).
AREA PLANTED WITH GENETICALLY MODIFIED CROPS, World-wide
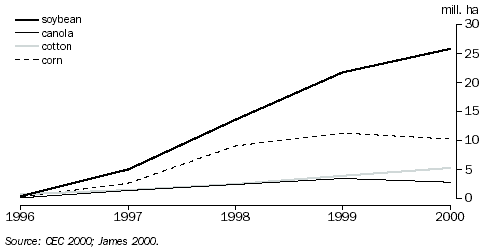
- In 2000, Australia sowed 0.15 million ha in Genetically Modified Crops. This compares with 30.3 million ha in the United States of America, 10 million ha in Argentina, 3 million ha in Canada, and 0.5 million ha in China.
- In 2001-02 Australia was estimated to have grown 220,000 ha of Genetically Modified Cotton.
- Currently, four genetically modified crops are commercially available in Australia: INGARD® insect resistant cotton; Monsanto's Roundup-ready® herbicide resistant cotton; a carnation with improved vase life; a carnation with violet coloured flowers.
- In 2001, 609,000 Australians belonged to an environmental group. Of these 220,000 were in a landcare or catchment management group and 68,000 were in marine conservation groups.
- Level of awareness of Landcare grew during the course of the 1990s and was greater in rural areas than capital cities.
PERCENTAGE OF POPULATION AWARE OF LANDCARE
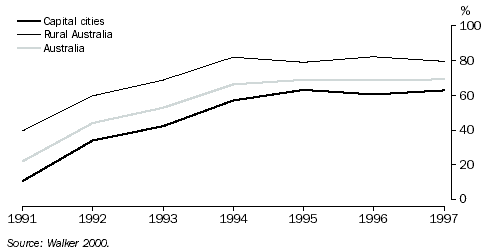
- Although awareness of Landcare increased from 1991 - 1997, concern for land degradation declined throughout Australia by 5% between 1992 and 1999.
- The main sources of information that prompted changes to farming practices were: other farmers; field days, seminars or conferences; and the media. Lack of information was seldom reported as being a factor hampering changes to farming practices, while a lack of resources or ensuing costs were reported as being the major barriers to change.
- In the early 1990s there were an estimated 200 community landcare groups in Australia (Walker 2000), but by 1998 this had grown to over 4000, involving an estimated 120,000 volunteers (Curtis and van Nouhuys 1999).
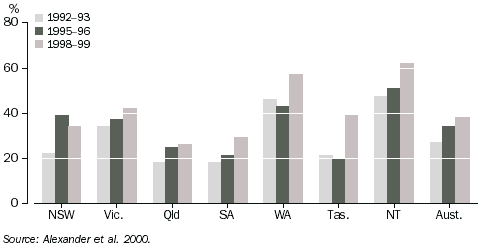
- In broadacre and dairy industries the proportion of properties with a landcare member increased from 27% in 1992-93, to 34% in 1995-96, to 38% in 1998-99.
LANDCARE MEMBERSHIP, All broadacre and dairy industries
- In 1998-99, 50.7 million trees and shrubs were planted as seedlings, and in 1999-2000 the number was 43.4 million.
- In 1999-2000 the total length of new fencing constructed to protect areas from grazing was 48,900 km, which was an increase of 41% from the previous year.
- The most common uses of the fencing were to protect newly planted trees and shrubs (15,500 km), protect creeks and rivers (9,000 km) and protect remnant vegetation (8,500 km).
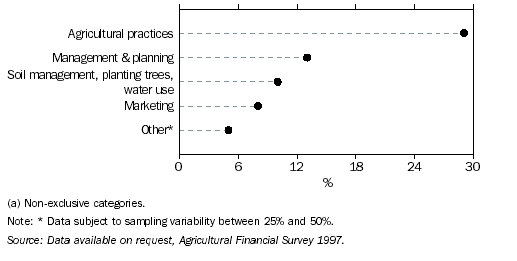
- Nearly 30% of farmers reported changing agricultural farm practices, while about 10% reported making changes to soil management, planting trees and water use.
CHANGES TO FARMING PRACTICES(a), For the three years to June 1997
CHAPTER 3. FORESTS AND FORESTRY IN AUSTRALIA
This chapter examines forests and their use. It starts by looking at the global situation and then goes on to examine forests and forestry in Australia. It also looks at the extent and types of forests as well as how they are used and valued by the Australian community. Both native forests and plantations are covered in this chapter.
Australia’s forests provide many values to the community. For example, forests are:
- a source of timber for manufacturing, housing and energy
- used for recreational, spiritual and cultural pursuits
- habitat for our flora and fauna
- catchments for much of our water supply
- a base for a diverse range of other commercial uses and
- an important component in the set of ecological processes which sustain life.
Forests can also accumulate and store carbon dioxide (CO2) from the atmosphere, playing a vital role as mitigators of rising atmospheric CO2 concentrations and global climate change.
Australia has 164 million ha of forest. There are many different types of native forest and Australia is one of 12 ‘mega-diverse’ countries, with ecosystems of exceptional variety and uniqueness. Clearing of native vegetation remains the single greatest threat to terrestrial biodiversity, particularly for forest ecosystems. Plantations occupy 1.5 million ha, less than 1% of the total forest area of Australia, but they supply over 50% of our wood.
Wood and paper products (forest products) are essential to the everyday lives of Australians, and include sawn timber, wood based panels and paper and paper products. These products are either imported or produced from timber removed from Australia’s native and plantation forests. Forest products are also an important export commodity for Australia. The potential impacts of timber harvesting are wide ranging, complex and vary enormously in their extent and the time taken for their implications to become apparent. Consequently, the magnitude and importance of these impacts is difficult to assess.
Ecologically sustainable forest use is a major objective for those concerned with the management of Australia’s forest resources. To achieve ecologically sustainable forest use, the challenge for forest managers is to strike a reasonable balance between the economic, ecological, social and cultural values of forests for current and future generations.
Selected statistics from the chapter
- In 2001, Australia had the sixth largest area of forest in the world; 164.4 million ha or 21.4 % of the total land area. This comprised 117 million ha of woodland, 43 million ha of open forest, and 5 million ha of closed forest.
- The majority of forest was Eucalypt forest (81%).
- Of the forested 164.4 million ha, 111.7 million ha are located on leasehold and private land; 20.5 million ha in nature conservation reserves; 17.7 million ha on other crown land and 11.8 million ha in multiple-use forests.
- In September 2000 the standing plantation resource had increased to 1.5 million ha (NPI 2001), less than 1% of the total forest area of Australia, but this supplies over 50% of wood removed from Australian forests (ABARE 2002).
- The forestry industry is gradually restructuring, where timber from native forest ecosystems is being supplemented by the expanding hardwood and softwood plantation resource.
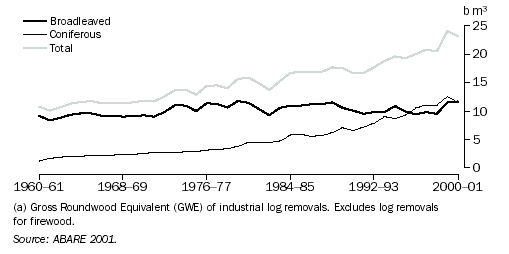
REMOVALS OF ROUNDWOOD(a)
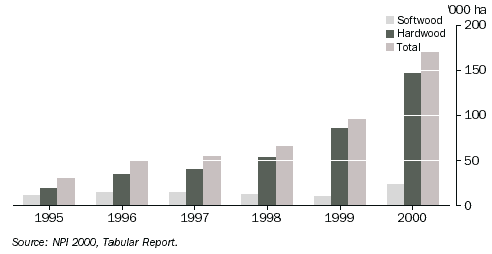
- The total area of new plantations in 2000 was 170,000 ha; with the area of new plantations steadily increasing since 1995 (NPI 2000).
NEW PLANTATIONS
- There are 27 million ha of protected native forest in Australia, 16% of the total native forest area.
- Under the Regional Forest Agreements process the area of protected forest reserves throughout Australia increased from 7.5 million ha to 10.4 million ha, a 39% increase. The area of protected old growth forest increased 42% to 3.4 million ha.
- Almost 78,000 people were employed in the Forestry and Wood and Paper manufacturing industries in 1999-2000; this was 0.87% of the total workforce.
- In 1999-2000, the the Wood and paper product manufacturing and Forestry and logging industries, had a turnover of $15b, added $5.91b to Australia's GDP, and spent approximately $2.6b on wages. The Wood and paper product manufacturing industry contibuted a significant proportion to the Forestry sector in each category.
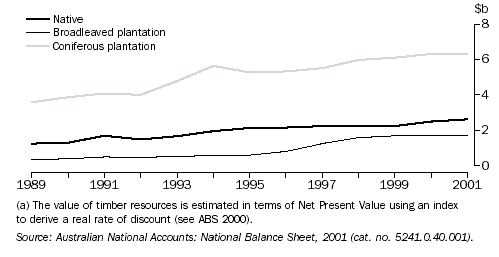
- The value of standing timber assets at June 2001 was $2,625m for native standing timber, and $1,729m and $6,325m for broadleaved and coniferous plantations, respectively.
VALUE(a) OF STANDING TIMBER
- In 2001, based on volume or weight, Australia was a net importer of sawnwood, paper and paperboard, and pulp, while it was a net exporter of roundwood, railway sleepers, wood-based panels, waste paper and woodchips.
- In 2001, Australia's is a net importer of forest products by value: forest products exports were valued at $1,812m while the imports were valued at $3,834m; to give a net deficit of $2,022m.
CHAPTER 4. MINING AND THE ENVIRONMENT
Australia enjoys many natural advantages that contribute to a thriving minerals sector. It is geologically diverse, hosting a large variety of mineral deposits, substantial geological information to aid exploration activities, a critical mass of capital, expertise and infrastructures, and a mature economy and stable political environment. It also features an extensive land area to accommodate and support mining and its associated impacts on the environment.
Australia is one of the leading mineral resource nations in the world. It has the largest identified reserves of lead, nickel, tantalum, mineral sands, zinc and uranium. It continues to dominate world production of bauxite, industrial diamonds, lead and mineral sands. It is the second largest world producer of nickel, zinc and uranium, the third largest producer of lithium and is among the top five world producers of recoverable black and brown coal, gold, iron ore and silver (GA 2001a).
However, the complexity of the environmental issues and consequences of mining, both locally and globally, have attracted public attention and political controversy. Unregulated disposal of wastes during the early development of the mineral industry has left a legacy of unrehabilitated wastes, polluted rivers and degraded land. Activities such as uranium mining adjacent to the Kakadu National Park World Heritage Property have added to the controversy. A range of environment protection measures are in place, and Australia has developed significant and world renowned capabilities in environmental research, impact reduction and land rehabilitation.
In this publication, the mining industry refers to both the mining of minerals as well as fossil fuels (coal, gas and oil). This is in line with the Australian and New Zealand Standard Industrial Classification (ANZSIC) which includes these under the one industry division (Division B — Mining).
The chapter begins with an overview of mineral and fossil fuel resources in Australia. It then covers economic and social aspects of the mining industry, including its evolution through the last century. There is further information on the structure of the industry, employment, exports and mining-related tourism. The second part of the chapter focuses on the environmental impacts of mining. This includes resource depletion, land disturbance, mining activities giving rise to air and water pollution as well as energy consumption and greenhouse gas emissions. Finally, there is a section on environmental management, which is important to the success and long-term prosperity in the mining sector. The topics covered include environment protection, environmental impact assessment, performance bonds, multiple land use, the voluntary Australian Minerals Industry Code for Environmental Management (MCA 2000) and environmental technologies.
Selected statistics from the chapter
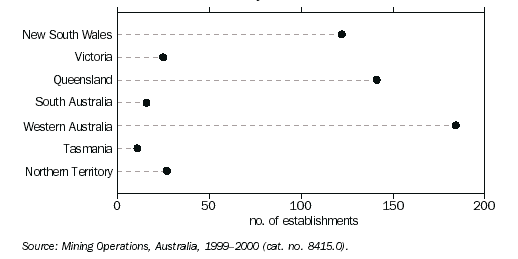
- Most of Australia's mines are located in Western Australia, Queensland and New South Wales.
MINING INDUSTRY DISTRIBUTION, By state - 1999-2000
- Australia has the world's largest reserves of bauxite, lead, mineral sands, nickel, tantalum, uranium and zinc (Geoscience Australia 2001).
- World-wide in 2001 Australia was the largest producer of bauxite, industrial diamonds, lead, lithium, mineral sands, tantalum and uranium. It was the second largest producer of zinc and the third largest producer of brown coal, gold, iron ore and nickel.
- In Australia at June 30, 2000, gold had an estimated resource life of 17 years, iron-ore - 100 years, uranium - 91 years, copper - 36 years, bauxite - 86 years, black coal - 205 years, brown coal - 611 years, crude oil - 11 years, and natural gas 49 years. The resource life measures the time period stocks of resources will exist, if the current rate of production is maintained and no new reserves are discovered.
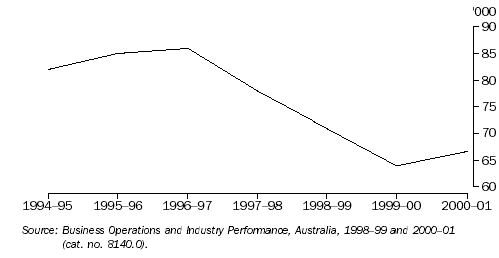
- Mining employment fell 24% from 86,000 in 1996-97 to 65,000 in 1999-2000. In June 2001, employment was 66,700.
MINING EMPLOYMENT
- The total value of exports from the mining industry was $55.7b in 2000-01, an increase of 28% from the previous year.
- In June 1994, 35% of mining industries used air quality monitoring, 46% monitor water quality, 18% used bioligical and meteorological monitoring and 55% used rehabilitation design.
- The total value of mining industry rehabilitation bonds was $1,127m in June 2000 .
- Total Energy consumption in Australia in 1997-98 was 4,858 PJ. The sectors which consumed the most energy were electricity generation (28%), transport (25%) and manufacturing (25%).
CHAPTER 5. WASTE AND WASTE MANAGEMENT IN AUSTRALIA
Substantial quantities of waste are generated from human consumption and activities related to the construction, operation, maintenance and renewal of human settlements (Newton et al. 2001). Australia currently consumes more resources and produces more waste than at any time in its history. In terms of sustainability, high resource consumption and increasing outputs of wastes are important features of Australian society and are related to the nation’s growing population and increasingly high standard of living. Without changes to consumption patterns and other behavioural changes, these trends look set to continue into the future.
Resource inputs and their transformation and consumption, waste generation and waste disposal are integral to the life of any society.
Pressures on the environment imposed by human populations are intricately linked to these processes. Under the principles of ecologically
sustainable development, non-renewable resources should be used prudently and efficiently, with care that the same function is available to future generations. Sink functions should not be used beyond their assimilative capacities. In this context, increasing resource use and
emission of wastes to ecological sinks are important issues to be addressed in working towards ecologically sustainable development in
Australia.
This chapter focuses on flows of waste in Australia. The chapter initially provides an overview of material flows, waste streams and waste
emissions, and the pressures they impose on the environment. This is followed by a more detailed discussion of particular waste streams,
namely: emissions of certain substances to land, water and air; solid wastes and their disposal at landfills; radioactive wastes; and litter and debris in coastal areas — and their associated environmental impacts. The chapter concludes with an outline of recent trends in waste management and waste minimisation (i.e. reuse, recovery and recycling), and their cost.
Selected statistics from the chapter
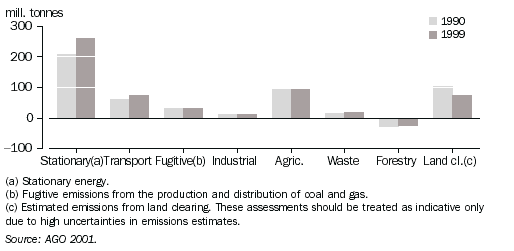
- Net greenhouse gas emissions calculated as carbon dioxide equivalents (CO2-e), increased 17.4% from 390.3 million tonnes in 1990, to 458.2 Mt in 1999 (Australian Greenhouse Office 2001).
- The energy sector accounted for the highest proportion of greenhouse gas emissions, 365 Mt CO2-e emissions in 1999, the agricultural sector produced 94 Mt CO2-e, while the forestry sector represented a net sink of almost 26 Mt CO2-e (Australian Greenhouse Office 2001).
GREENHOUSE GAS EMISSIONS (CO2-e), By sector
- According to the National Pollutant Inventory (2001) the majority of all pollution in 1999-2000 was caused by air emissions - 3.13 million tonnes or 96%, compared to water and land emissions which accounted for 0.11 million tonnes (3%), and 0.002 million tonnes (<1%), respectively.
- In 1999-2000, 42% of all air emissions were produced by the metal product manufacturing sector, and 30% were produced by the electricity and gas sector (NPI 2001).
- In 1999-2000, 49% of all water emissions and 42% of land emissions were produced by the water supply, sewerage and drainage services sector. 28% of water emissions were produced by the petroleum, coal, chemical and associated product manufacturing sector. Metal ore mining produced 31% of all land emissions (NPI 2001).
- In 1994, 72% of Australia's waste water (used for some purpose then usually treated) was disposed of into coastal waters, 17.5% to inland waters, 9.5% to land and 1% was directly reused (Thomas et al. 1997).
- Nationally in 1999-2000, local government current expenditure on solid waste management was $1,048m, while capital expenditure was $96m. Current expenditure on waste water management was $649m, while capital expenditure was $394m. Total current expenditure protection expenditure by local government was $1,899m, while capital expenditure was $607m.
- 21.2 million tonnes of solid waste were received and disposed of at landfills throughout Australia in 1996-97. This amount was approximately evenly distributed between privately operated and general government operated landfills.
- In 2001, 48% of Australian households used recycled paper, 28% did not, the remainder used recycled paper sometimes/depends or did not know.
- In 2001, 51% of Australian households used refillable containers, 34% did not, the remainder used them sometimes/depends or did not know.
- In 2001, only 19% of Australian households used organically grown fruit and vegetables, 56% did not, the remainder used them sometimes/depends or did not know.
- In 2001, 37% of people did not use environmentally friendly products (like those listed above) because they were more expensive, 19% said they were not readily available, and 16% believed they were inferior in quality.
- In 2001, 85% of Australian households recycled paper and 83% recycled old clothes and rags. Just 12% of households recycled motor oil, and 50% recycled kitchen or food waste.
- In 2001, the main reason that people did not recycle (73% of households), is because the household did not use any or enough of the materials. 16% said that no services or facilities were provided, while 13% were not interested or said that it required too much effort.
- In the year 2000, Australia-wide, 89% of the population had access to steel can recycling. In 1991, 2 councils collected steel cans for recycling, by the end of the year 2000, 375 councils were participating in steel can recycling. This represented an increase from 0.01% in 1991 to 40% in 2000.
|
 Print Page
 Print All