 TRADE
TRADE
BALANCE OF TRADE
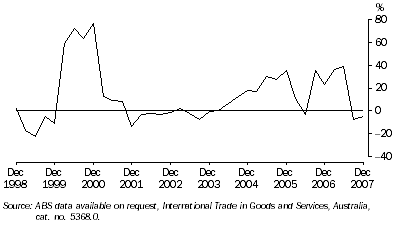
The value of Western Australia's trade surplus declined by 4.5% ($457 million) to $9,604 million through the year to December quarter 2007, following a decrease in the previous period of 7.7% ($766 million) through the year to September quarter 2007. The decline was the result of imports growth (11.3% or $630 million) exceeding exports growth (1.1% or $173 million).
VALUE OF WESTERN AUSTRALIA'S TRADE SURPLUS, Change from same quarter previous year

The declining growth in Western Australia's trade surplus between the December quarter 2006 and 2007, was mainly the result of the state's trade balance falling with Japan (down $496 million), closely followed by India (down $493 million) and Finland (down $426 million). There were significant gains, however, in the state's trade surpluses with United Kingdom (up $1,353 million), Republic of Korea (up $245 million ) and United States of America (up $195 million).
EXPORTS
The value of Western Australia's exports rose by 1.1% ($173 million) to $15,283 million through the year to December quarter 2007. The major commodities contributing to the increase were crude petroleum oils (up $526 million or 30.0%), non-monetary gold (up $413 million or 17.1%), iron ore and concentrates (up $164 million or 4.1%), ores and concentrates (up $103 million or 51.7%) and natural gas (up $64 million or 5.8%). Commodities detracting from exports growth were mainly combined confidential items (down $443 million or 16.3%), nickel ores and concentrates (down $325 million or 64.4%), nickel (down $123 million or 34.5%) and wheat (down $99 million or 24.2%).
IMPORTS
The value of Western Australia's imports rose by 11.3% ($630 million) to $6,218 million through the year to December quarter 2007. Strong imports growth was primarily driven by crude petroleum oils (up $202 million or 47.2%), non-monetary gold (up $153 million or 12.5%), refined petroleum oils (up $106 million or 29.6%), fertilizers (up $90 million or 2446.2%) and civil engineering plant and equipment (up $71 million or 33.6%).
 Print Page
 Print All