CONSUMER PRICE INDEX
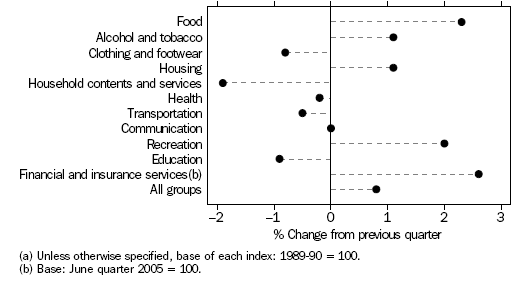
Between June quarter 2007 and September quarter 2007, the all-groups CPI for Melbourne rose by 0.8%. The groups which recorded the largest increases were Financial and insurance services (2.6%), Food (2.3%) and Recreation (2.0%). The groups which recorded largest decreases were Household contents and services (-1.9%), Education (-0.9%) and Clothing and footwear (-0.8%).
Between September quarter 2006 and September quarter 2007, the all-groups CPI for Melbourne rose by 2.1%. The CPI all-groups weighted average for the eight capital cities rose by 1.9% over the same period. The biggest yearly increases for Melbourne occurred in Health (4.7%), Alcohol and tobacco (3.8%) and Financial institution and insurance services (3.6%). The groups which recorded decreases for the year were Household contents and services (-1.4%) and Transportation (-1.0%).
CONSUMER PRICE INDEX(a), Melbourne
- September qtr 2007

CONSUMER PRICE INDEX(a)(b)(c), By Group, Melbourne |
|
 | Melbourne | Melbourne |
 | Sep Qtr 2006 | Dec Qtr 2006 | Mar Qtr 2007 | Jun Qtr 2007 | Sep Qtr 2007 | Change
from
previous
quarter | Change
for
year
ending |
 | index | index | index | index | index | % | % |
|
| Food | 170.7 | 171.7 | 168.2 | 171.8 | 175.8 | 2.3 | 3.0 |
| Alcohol and tobacco | 238.2 | 241.2 | 243.4 | 244.6 | 247.3 | 1.1 | 3.8 |
| Clothing and footwear | 109.0 | 109.0 | 108.4 | 112.0 | 111.1 | -0.8 | 1.9 |
| Housing | 116.4 | 117.4 | 118.6 | 119.2 | 120.5 | 1.1 | 3.5 |
| Household contents and services | 125.6 | 125.6 | 124.8 | 126.3 | 123.9 | -1.9 | -1.4 |
| Health | 231.4 | 230.9 | 239.0 | 242.7 | 242.2 | -0.2 | 4.7 |
| Transportation | 161.3 | 154.9 | 155.8 | 160.5 | 159.7 | -0.5 | -1.0 |
| Communication | 110.0 | 110.3 | 110.5 | 110.7 | 110.7 | - | 0.6 |
| Recreation | 133.3 | 134.3 | 134.6 | 132.8 | 135.5 | 2.0 | 1.7 |
| Education | 245.7 | 245.8 | 255.2 | 255.8 | 253.6 | -0.9 | 3.2 |
| Financial and insurance services(b) | 103.5 | 103.3 | 103.3 | 104.5 | 107.2 | 2.6 | 3.6 |
| All groups | 153.7 | 153.5 | 153.8 | 155.6 | 156.9 | 0.8 | 2.1 |
|
| - nil or rounded to zero (including null cells) |
| (a) Unless otherwise specified, base of each index: 1989-90 = 100.0. |
(b) Base: June quarter 2005 = 100.0.
(c) Due to formatting requirements of the web environment this table contains less data items than the PDF version of this publication. |
| Source: Consumer Price Index, Australia (cat. no. 6401.0). |
 Print Page
 Print All
 Print Page
 Print All