NEW SOUTH WALES
New South Wales is the largest state in Australia in terms of gross state product. In 2005-06 it represented around one third of Australian Gross Domestic Product (GDP) in level terms.
Gross state product, New South Wales - Chain volume measures(a) |
|  |
 | 2000-01 | 2001-02 | 2002-03 | 2003-04 | 2004-05 | 2005-06 |  |
Values ($m) |  |
|  |
| GSP(A) | 280 684 | 286 897 | 294 645 | 301 782 | 306 203 | 310 771 |  |
| GSP(P) | 275 015 | 282 117 | 290 411 | 300 071 | 306 547 | 311 450 |  |
| GSP(I/E) | 286 354 | 291 678 | 298 879 | 303 493 | 305 859 | 310 091 |  |
| GDP | 784 017 | 813 542 | 839 187 | 873 197 | 896 568 | 921 747 |  |
Percentage changes from previous year (%) |  |
|  |
| GSP(A) | 2.3 | 2.2 | 2.7 | 2.4 | 1.5 | 1.5 |  |
| GSP(P) | 1.6 | 2.6 | 2.9 | 3.3 | 2.2 | 1.6 |  |
| GSP(I/E) | 3.0 | 1.9 | 2.5 | 1.5 | 0.8 | 1.4 |  |
|  |
| (a) Reference year for chain volume measures is 2004-05. |
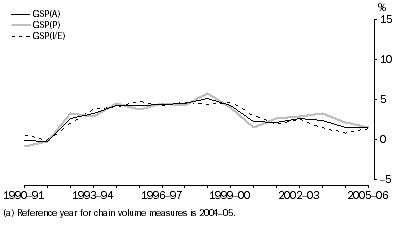
New South Wales GSP(P) growth was positive throughout the time series with the exception of 1990-91 and 1991-92. Growth rates were quite high between 1992-93 and 1999-2000, with a peak in 1998-99. From 2000-01 the growth rates have moderated growing at an average of around 2%. In general GSP(P) and GSP(I/E) displayed similar growth throughout the time series, however there were some divergences between the two measures in 2000-01, 2003-04, and 2004-05.
Gross State Product, New South Wales
- Chain volume measures(a)
: Percentage changes from previous year

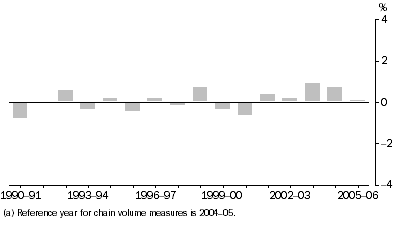
The difference between the GSP(A) and GSP(I/E) growth has been less than 1.0 percentage point throughout the whole time series and was zero in 2005-06.
Difference between GSP(A) and GSP(I/E), Percentage changes
- New South Wales
: Chain volume measures(a)

GSP, New South Wales - Chain volume measures(a): Contribution to growth |
|  |
 | 2000-01 | 2001-02 | 2002-03 | 2003-04 | 2004-05 | 2005-06 |  |
 | % pts | % pts | % pts | % pts | % pts | % pts |  |
|  |
| Agriculture, forestry & fishing | 0.2 | - | -0.7 | 0.4 | 0.1 | 0.1 |  |
| Mining | - | - | - | 0.1 | 0.1 | -0.1 |  |
| Manufacturing | 0.2 | 0.2 | 0.3 | - | -0.2 | -0.1 |  |
| Electricity, gas & water supply | 0.1 | -0.1 | - | - | - | 0.1 |  |
| Construction | -1.0 | 0.6 | 0.9 | 0.4 | 0.3 | 0.3 |  |
| Wholesale trade | - | - | -0.1 | -0.1 | 0.2 | - |  |
| Retail trade | 0.1 | 0.2 | 0.3 | 0.2 | 0.1 | - |  |
| Accommodation, cafes & restaurants | 0.1 | - | 0.1 | 0.1 | 0.2 | - |  |
| Transport & storage | - | 0.1 | 0.2 | 0.1 | 0.2 | 0.1 |  |
| Communication services | - | - | 0.1 | 0.1 | 0.1 | 0.2 |  |
| Finance & insurance | -0.3 | 0.1 | 0.5 | 0.6 | 0.2 | 0.5 |  |
| Property & business services | 1.5 | -0.1 | 0.4 | 0.5 | -0.2 | -0.2 |  |
| Government administration & defence | -0.1 | 0.3 | -0.2 | -0.1 | - | 0.1 |  |
| Education | - | 0.1 | 0.1 | - | 0.1 | - |  |
| Health & community services | 0.2 | 0.3 | 0.2 | 0.2 | 0.3 | 0.2 |  |
| Cultural & recreational services | 0.1 | -0.1 | 0.1 | 0.1 | 0.1 | 0.1 |  |
| Personal & other services | 0.1 | - | 0.1 | 0.1 | - | -0.1 |  |
| Ownership of dwellings | 0.3 | 0.3 | 0.3 | 0.3 | 0.4 | 0.3 |  |
| Taxes less subsidies on products | -0.2 | 0.4 | 0.5 | 0.3 | 0.3 | 0.2 |  |
| Statistical discrepancy | 0.7 | -0.3 | -0.2 | -0.9 | -0.7 | -0.2 |  |
| GSP(A) | 2.3 | 2.2 | 2.7 | 2.4 | 1.5 | 1.5 |  |
|  |
| - nil or rounded to zero (including null cells) |
| (a) Reference year for chain volume measures is 2004-05. |
In 2005-06 the main industries that contributed to New South Wales GSP growth were Finance and insurance (0.5 percentage points) and Construction and Ownership of dwellings (each 0.3 percentage points). The main negative contributing industry was Property and business services (-0.2 percentage points).
 Print Page
 Print All