AGRICULTURE, FORESTRY AND FISHING
Definition and scope
The Agriculture, forestry and fishing industry engages in activities such as breeding, keeping and cultivation of plants and animals; afforestation, harvesting and gathering of forestry products; and catching, gathering and breeding of marine life.
ANZSIC93 Division A, Agriculture, forestry and fishing, consists of four sub-divisions:
- Agriculture (sub-division 01)
- Services to agriculture (sub-division 02)
- Forestry and logging (sub-division 03)
- Commercial fishing (sub-division 04).
Summary of GSP(P) sources and methods
The methodology for Agriculture, forestry and fishing uses a combination of double deflation and quantity revaluation.
The sub-divisions Agriculture and Services to agriculture are compiled together using the double deflation approach. That is, the volume measures of intermediate input are subtracted from volume measures of output, both valued in the prices of the previous year, to derive volume measures of GVA.
The sub-divisions Forestry and logging and Commercial fishing are compiled separately using the quantity revaluation approach.
The main source of data on state Agriculture outputs and most inputs is the ABS collection, Value of Agricultural Commodities Produced, Australia (VACP) (cat. no. 7503.0). For Forestry and fishing and some of the Agriculture inputs, Australian Bureau of Agricultural and Resource Economics (ABARE) data are used.
The double deflation method is used for all but the latest year for Agriculture and Services to agriculture as the VACP collection is released with a lag of one year. For the latest year, the method for all of Agriculture, forestry and fishing sub-divisions is an output indicator approach. ABARE forecasts of production, of the major agricultural commodities in each state, are used as the output indicator. The volume movements in the major commodities in each individual state are obtained using quantity revaluation.
These are used to extrapolate reference year volume estimates of GVA by state for Agriculture, forestry and fishing. The state volume GVAs are benchmarked to the annual national industry volume GVA.
Results for Agriculture, forestry and fishing
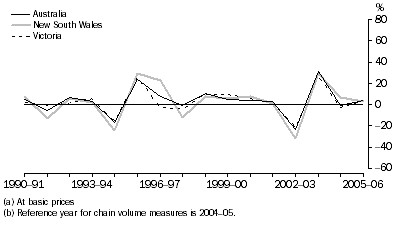
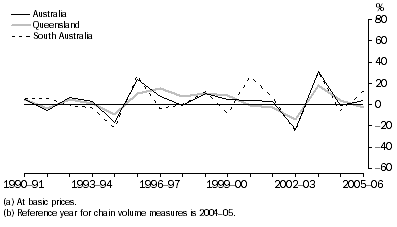
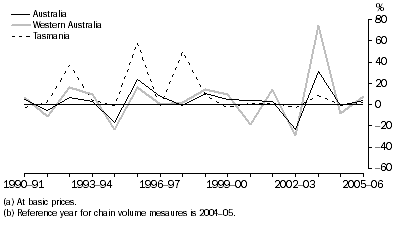
Agriculture, forestry and fishing gross value added(a), Chain volume measures(b) |
|  |
| 2000-01 | 2001-02 | 2002-03 | 2003-04 | 2004-05 | 2005-06 | |
Values ($m) | |
| |
| New South Wales | 6 512 | 6 586 | 4 457 | 5 751 | 6 147 | 6 339 | |
| Victoria | 6 647 | 6 751 | 5 309 | 6 749 | 6 544 | 6 785 | |
| Queensland | 5 755 | 5 608 | 4 830 | 5 705 | 5 930 | 5 778 | |
| South Australia | 3 454 | 3 684 | 2 733 | 3 572 | 3 343 | 3 773 | |
| Western Australia | 2 902 | 3 321 | 2 354 | 4 116 | 3 777 | 4 068 | |
| Tasmania | 997 | 1 011 | 984 | 1 066 | 1 065 | 1 088 | |
| Northern Territory | 388 | 414 | 381 | 312 | 327 | 302 | |
| Australian Capital Territory | 17 | 15 | 15 | 19 | 19 | 19 | |
| Australia | 26 363 | 27 194 | 20 807 | 27 340 | 27 153 | 28 151 | |
Percentage changes from previous year (%) | |
| |
| New South Wales | 7.5 | 1.1 | -32.3 | 29.0 | 6.9 | 3.1 | |
| Victoria | 5.9 | 1.6 | -21.4 | 27.1 | -3.0 | 3.7 | |
| Queensland | -0.4 | -2.6 | -13.9 | 18.1 | 3.9 | -2.6 | |
| South Australia | 26.7 | 6.7 | -25.8 | 30.7 | -6.4 | 12.9 | |
| Western Australia | -18.6 | 14.4 | -29.1 | 74.9 | -8.2 | 7.7 | |
| Tasmania | 1.2 | 1.4 | -2.7 | 8.3 | -0.1 | 2.1 | |
| Northern Territory | 23.4 | 6.6 | -8.1 | -18.0 | 4.7 | -7.7 | |
| Australian Capital Territory | 20.6 | -10.1 | -0.7 | 26.1 | 0.3 | 1.4 | |
| Australia | 4.0 | 3.2 | -23.5 | 31.4 | -0.7 | 3.7 | |
| |
| (a) At basic prices. |
| (b) Reference year for chain volume measures is 2004-05. |
Agriculture, forestry and fishing gross value added(a), Chain volume measures(b)-Percentage changes
Agriculture, forestry and fishing gross value added(a), Chain volume measures(b)-Percentage changes
Agriculture, forestry and fishing gross value added(a), Chain volume measures(b)-Percentage changes
 Agriculture, forestry and fishing gross value added(a),
 Chain volume measures(b)-Percentage changes
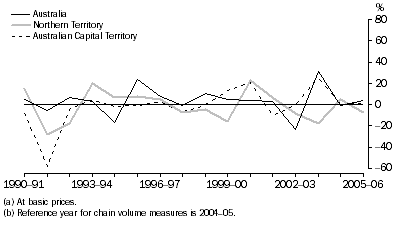
Throughout the time series, all states except Tasmania, the Northern Territory and the Australian Capital Territory exhibited a similar growth pattern to the Australia series. Overall, the growth in the agricultural industry is variable due to the impact of weather patterns on the industry. The two droughts in 1994-95 and 2002-03 had strong negative impacts on growth. During the 1994-95 drought all states except the Northern Territory experienced negative growth. The 2002-03 drought saw all states having negative growth with New South Wales, Western Australia, South Australia and Victoria showing the largest negative growth. Most states showed large positive growth in the years following the droughts.
Agriculture, forestry and fishing gross value added, State shares - Current prices |
| |
| 1989-90 | 1994-95 | 1999-00 | 2003-04 | 2004-05 | 2005-06 | |
| % | % | % | % | % | % | |
| |
| New South Wales | 29.6 | 24.1 | 24.9 | 22.2 | 22.6 | 21.7 | |
| Victoria | 21.5 | 21.5 | 21.8 | 23.4 | 24.1 | 24.1 | |
| Queensland | 20.1 | 22.2 | 21.4 | 18.7 | 21.8 | 22.1 | |
| South Australia | 11.1 | 11.0 | 12.1 | 14.5 | 12.3 | 12.8 | |
| Western Australia | 13.4 | 15.4 | 14.4 | 16.5 | 13.9 | 14.0 | |
| Tasmania | 3.8 | 4.7 | 3.7 | 3.5 | 3.9 | 4.1 | |
| Northern Territory | 0.5 | 1.1 | 1.5 | 1.1 | 1.2 | 1.1 | |
| Australian Capital Territory | 0.1 | 0.1 | 0.1 | 0.1 | 0.1 | 0.1 | |
| Australia | 100.0 | 100.0 | 100.0 | 100.0 | 100.0 | 100.0 | |
| |
Victoria, Queensland and New South Wales accounted for around 68% of Australian Agriculture, forestry and fishing GVA in 2005-06. New South Wales share of the industry has gradually decreased throughout the time series from 29.6% in 1989-90 to 20.6% in 2005-06. All other states increased their share over this period except for the Australian Capital Territory which recorded stable industry shares throughout the time series.
 Print Page
 Print All