8681.0 - Information Media and Telecommunications Services, Australia, 2013-14  Quality Declaration
Quality Declaration ARCHIVED ISSUE Released at 11:30 AM (CANBERRA TIME) 29/06/2015 First Issue
Page tools:
 Print Page Print Page
 Print All Print All
| ||||||||||||||||||||||||||||||||||||||||||||||||
DETAILED FINDINGS FOR INFORMATION MEDIA AND TELECOMMUNICATIONS INDUSTRY This page presents detailed findings about the Information Media and Telecommunications (IMT) industry in 2013-14. Additional information is presented for; sources of income, key expense items and capital expenditure, and is presented at the industry division level. The information in this page is complementary to the Main Features page. Further information on the IMT industry, including time series for the key data items, is available from Australian Industry (cat. no. 8155.0). SOURCES OF INCOME This section presents an activity view of the sources of income for businesses classified to the IMT industry, as presented in Tables 2 and 5 (refer to the Downloads tab). While a business unit is classified to a single ANZSIC subdivision based on its predominant activity, a business may also undertake other activities. Examples include telephone service providers also supplying internet access services, and print publishing businesses increasingly engaged in internet publishing. As these income activities occur across subdivisions within the IMT industry, the following information is presented by source of income at the division level, not by ANZSIC subdivision classification. Businesses which are not classified to an IMT ANZSIC subdivision but provide IMT services as a secondary activity are out of scope of the estimates presented in this publication. Internet contribution to sales and service income Total sales and service income for the IMT industry in 2013-14 was $72,848m. A feature of the Information Media and Telecommunications industry in 2013-14 was the impact of the internet on business models. Sales and service income was increasingly driven by products such as as online news sites, streamed media content, internet hosted applications and over-the-top services, such as VoIP, that bypass traditional telecommunications carriers. The internet's contribution to the IMT industry can be viewed through its contribution to total sales and service income for the activities in the table below. From this viewpoint the contribution of the internet to the IMT industry in 2013-14 was $19,736m, or 27.1% of total sales and service income. Internet's contribution to IMT industry
Publishing and broadcasting activities Sales and service income from broadcasting and publishing activities (excluding copyrights) was $19,408m. Internet publishing and broadcasting services contributed 17.3% (or $3,356m) to this total. Sales and service income from total publishing activities (excluding copyrights) in the IMT industry totalled $9,110m in 2013-14, split between advertising ($5,486m or 60.2%) and circulation, subscription and other sales ($3,624m or 39.8%). The contribution of internet sourced publishing income was similar for both advertising (21.4%) and circulation, subscription and other sales (24.8%). Publishing businesses can be defined as either multi-channel publishers or pure play internet publishers. Multi-channel publishers output content in both print and internet versions, whereas pure play internet publishers only publish their media content on the internet. Of the $1,171m of internet based advertising income, publishing businesses that have a multi-channel presence had a higher share ($861m or 73.5%) than pure play internet publishers ($311m or 26.5%). For internet sourced circulation, subscription and other sales income of $897m, this was evenly split between publishers that have a multi-channel presence ($463m or 51.6%) and pure play internet publishers ($434m or 48.4%). Sales and service income from total broadcasting activities in the IMT industry amounted to $10,298m with $1,288m (or 12.5%) sourced from internet broadcasting products. Examples of internet broadcasting services include digital radio, catch-up television, video on demand and Internet Protocol Television (IPTV) subscriptions. Sales and service income for traditional broadcasting services were comprised of traditional television ($8,059m) and traditional radio services ($951m). 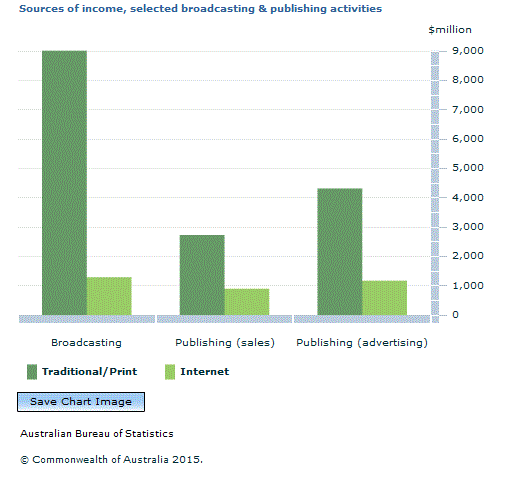 Telecommunications, internet and data hosting activities Income from telecommunications, internet services and application hosting, data and information storage services totalled $38,122m in 2013-14, making up over half (52.3%) of all sales and service income in the IMT industry. Telecommunications and internet services totalled $32,927m and was split between fixed networks ($16,015m or 48.6%), mobile, satellite and wireless networks ($16,640m or 50.5%) and other telecommunications services ($271m or 0.8%). Telecommunications services (excluding internet service provision) were worth $24,419m and this income was split between fixed network services ($10,431m or 42.7%) and mobile, satellite and wireless network services ($13,988m or 57.3%). About 90% of this income was generated through networks that were operated by the businesses providing the service. Income from internet service provision equalled $8,237m in 2013-14, and was split between services provided over fixed networks ($5,585m or 67.8%) and mobile, satellite and wireless networks ($2,652m or 32.2%). Activities of growing importance for the IMT industry were application hosting, data and information storage services, with sales and service income of $5,195m in 2013-14. These activities include application and web hosting, streaming services, automated data capture and processing, as well as database services. These activities represent the internet based computing services that are made available to clients on demand and are known as 'cloud computing'. The IMT industry also earns income from the sale of communications and computer equipment, often provided as part of a bundled package with the services detailed above. In 2013-14 the sales of equipment were valued at $3,211m with 91.8% (or $2,948m) being made up of hand-held equipment, including smart-phones and tablets. 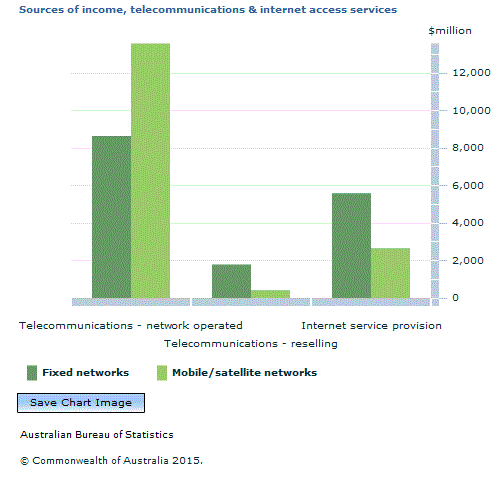 Film and music activities The Information Media and Telecommunications industry derived $4,960m of sales and service income from motion picture activities in 2013-14. The largest share of this income came from production and post-production services at $2,234m (or 45.0%). This was followed by distribution (including rights and royalties) at $1,613m (32.5%) and motion picture exhibition (including box office ticket sales) at $1,113m (22.4%). Income from music publishing and royalties and sound recording services totalled $549m in 2013-14, with most of this income ($448m or 81.5%) coming from the acquiring, registering and selling of rights. KEY EXPENSE ITEMS This section explains the key expense items at the Division level, as presented in Table 3 of the data cube. For 2013-14 the top seven expense items for the IMT industry were:
These expenses are explained in further detail below. Selected labour expenses Selected labour expenses was the largest expenditure item incurred by the IMT industry in 2013-14. Total expenses for the industry were $65,901m, of which 20.8% (or $13,682m) was attributable to selected labour expenses. This demonstrates the importance of human resources for the creation and distribution of outputs such as media content and non-customised software. Depreciation and amortisation The second largest expense item for the IMT industry in 2013-14 was depreciation and amortisation, which totalled $9,657m (or 14.7%) of total expenses. The IMT industry is a heavy user of capital items as an input to the production process, reflected in the depreciation of capital items. Purchases Purchases for the IMT industry in 2013-14 totalled $8,066m, the fourth largest expense. Almost two thirds of this value ($5,004m) comprised purchases of finished goods for resale, such as handheld communications equipment and pre-recorded media. The remaining $3,062m included purchases of materials, components and utilities. Telecommunication expenses Telecommunications services was not only the largest source of income for the IMT industry, but telecommunications expenses represented the fifth largest cost incurred by businesses in this industry. Of the $65,901m in total expenses, telecommunications expenses represented $7,483m, 11.4% of total expenses. These expenses included wholesale network payments, interconnection fees, purchases of bandwidth, fixed and mobile telephone service costs and internet and web hosting services. This high expense value represents the IMT industry's reliance on telecommunications not only as an output, but also as a key input component. Payments to other businesses Another key expense incurred by the IMT industry in 2013-14 were payments to contractors for services, $5,540m, or 8.4% of total expenses. This included payments for information technology service contracts, consultants, commissions to media buyers, call centre operations and delivery and transport expenses. The diverse range of subdivisions operating within this industry is demonstrated by the variety of contracted expenses incurred. In addition to contractor payments for selected services, businesses in the IMT industry also spent $340m in 2013-14 on payments to businesses for labour hire and recruitment services such as casting agencies for talent. Royalties expenses Royalties expenses include payments made under licensing arrangements and payments for the use of copyrights. In 2013-14 the total royalty expenses incurred by the IMT industry was $3,038m. Of this, $2,484m was attributed to music, film and television royalty expenses, reflecting large payments for the use of intellectual property such as program format rights, film hire and mechanical song royalties. These intangible costs can be thought of as inputs into the creation, enhancement and dissemination of other services such as television programming, theatre projection and music streaming. CAPITAL EXPENDITURE Total capital expenditure for the IMT industry in 2013-14 was $14,323m. As can be seen from the table below, the largest component of capital expenditure by asset type was structures, buildings and dwellings at $7,688m. This reflects the expansion and upgrade of long-life telecommunications infrastructure - fixed, wireless, mobile and satellite - to meet the needs of Australian consumers and business. Capital expenditure on equipment and machinery was $2,923m. The biggest component was communications equipment ($1,605m) such as telecommunications equipment, main exchange and other switching equipment, TV and radio broadcast studio equipment and TV and radio transmitters and receivers. Capital expenditure on software totalled $2,223m for the IMT industry in 2013-14. The figures included spending on capitalised license fees, software developed in-house, purchase of databases and investments in applications or 'apps'. The capital expenditure on software is indicative of the business transformation taking place within the IMT industry as the sector seeks to use software assets to improve internal efficiency and better engage with external customers. Capital expenditure
Please refer to Table 4 in the data cube for more detailed information on capital expenditure. FOOTNOTE 1. According to the Australian Communications and Media Authority (ACMA) Communications Report, 2013-14 and data from the ABS' Internet Activity, Australia, December 2014 (cat. no. 8153.0) publication, "mobile internet subscribers account for 86 per cent of all mobile services in operation at June 2014." REFERENCES ACMA (Australian Communications and Media Authority), 2014, Communications Report, 2013-14, viewed 16 June 2015, <http://www.acma.gov.au/theACMA/Library/Corporate-library/Corporate-publications/communications-report>. Document Selection These documents will be presented in a new window.
|
||||||||||||||||||||||||||||||||||||||||||||||||
