 APPENDIX 1: COMPARISON OF NET AND GROSS INDUSTRY INDEXES
Introduction
Background
Evaluation
Findings
INTRODUCTION
1 Users requested information on the practical relevance of price indexes compiled to suit the two different principal purposes; the support of National Accounts and Balance of payments compilation (gross industry indexes); and inflation monitoring (net industry indexes).
2 The ABS has compiled an analytical net industry Materials Used in Manufacturing Industries (MUMI) index to compare with the currently published gross industry MUMI index.
3 This appendix provides the results from the comparison made over the September quarter 2009 to the December quarter 2011 period.
BACKGROUND
4 When the PPIs and ITPIs are designed to support the compilation of the National Accounts and Balance of Payments, the most coherent basis for price indexes includes all transactions occurring within an economy and total inputs and outputs for each industry level. As the coverage of each industry is complete the indexes are termed gross industry indexes. The current Australian PPIs are gross industry indexes.
5 As products flow through different production processes within an industry, price movements will be counted multiple times (see example in paragraph 8 below). As a result gross industry indexes are not principally designed for inflation monitoring.
6 An alternative to indexes compiled on a gross industry basis are indexes compiled on a net industry basis. When indexes are compiled on a net industry basis, instances of multiple counting of price movement are removed for a given industry. Net industry price indexes exclude intra–industry transactions in a manner similar to a set of consolidated accounts of a group of enterprises.
7 Therefore, a net industry price index for a specific industry is restricted to transactions outside that industry, used as capital, exported (for an output index) or imported (for an input index). The resultant price indexes are a representation of the inflationary pressure experienced or created by the industry as a consolidated unit.
8 The net and gross industry bases can be more clearly explained by an example. The transactions captured for a motor vehicle manufacturing gross industry index would include both the sales of the parts (this includes sales of parts to other businesses within the same industry) and the sales of the finished cars, even though the price change of the parts would be included in the price change of the finished cars. A motor vehicle manufacturing net industry index would measure only the price change of motor vehicles sold to other industries of the economy and would exclude the price change of the parts (sold to businesses in the same industry) as a separate product.
EVALUATION
9 A net industry MUMI excludes inputs that are produced within the same (i.e. manufacturing) industry, which increases the weight (or influence) of the remaining inputs, such as those from the Agriculture and Mining industries.
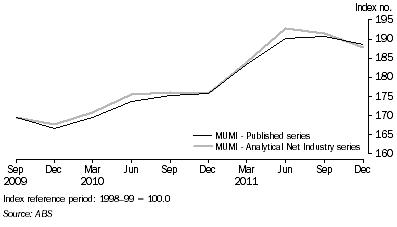
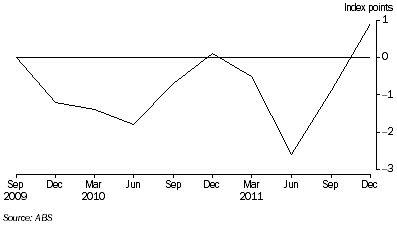
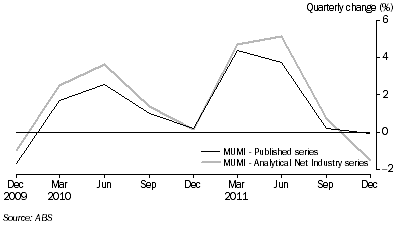
10 The net and gross industry indexes and their behaviour are illustrated in Graphs 1, 2 and 3.
11 Graph 1 shoes that the published MUMI index and analytical net industry MUMI index tend to diverge and converge over time. At the end of the analysis period the indexes were approximately one index point apart after more than two years.
GRAPH 1 – PUBLISHED MUMI INDEX VS ANALYTICAL NET INDUSTRY MUMI INDEX: INDEX NUMBER

12 Graph 2 shows that the difference between the indexes for any quarter varies between –2.5 and +1.0 index points.
GRAPH 2 – PUBLISHED MUMI INDEX LESS ANALYTICAL NET INDUSTRY MUMI INDEX: INDEX POINTS

13 Graph 3 shows the quarterly percentage change difference between the indexes. The quarterly percentage change of the analytical net industry MUMI tends to track above the published MUMI series.
GRAPH 3 – PUBLISHED MUMI INDEX VS ANALYTICAL NET INDUSTRY MUMI INDEX: QUARTERLY PERCENTAGE CHANGE

FINDINGS
14 The analysis shows that there are differences between the analytical net industry MUMI and the published MUMI series.
 Print Page
 Print All