PERSONAL AND OTHER SERVICES
Definition and scope
The Personal and other services industry includes all units mainly engaged in providing personal services.
ANZSIC93 Division Q, Personal and other services, consists of three sub-divisions:
- Personal services (sub-division 95)
- Other services (sub-division 96)
- Private households employing staff (sub-division 97).
Summary of GSP(P) sources and methods
The methodology for Personal and other services uses an output indicator approach to compile state by industry GVA estimates. Personal and other services are produced by both public and private sectors, consequently, the output indicators are derived as the sum of public and private output. An output indicator method is derived for both the public and private sectors using the price deflation method.
Public sector current price data are sourced from the ABS GFS. A deflator is derived using wage prices from the ABS Labour Price Index, and materials prices taken from the PPI and Import Price Index, Australia (cat. no. 6414.0). These current price and deflator estimates are used to construct a volume indicator for the public sector.
Private sector current price estimates by state are sourced from QBIS. Prior to QBIS the movements in the national current price private sector turnover are used to backcast the state QBIS estimates. Private sector deflators are constructed using various components of the ABS CPI by capital city, and HFCE implicit price deflators by state. The output volume estimates are then used to derive volume estimates for the private sector.
The state output indicators are used to derive volume measures of GVA for Personal and other services. The state volume GVAs are then benchmarked to the annual national industry volume GVA.
Results for Personal and other services
Personal and other services gross value added(a), Chain volume measures(b) |
|  |
 | 2000-01 | 2001-02 | 2002-03 | 2003-04 | 2004-05 | 2005-06 |  |
Values ($m) |  |
|  |
| New South Wales | 4 897 | 5 020 | 5 414 | 5 586 | 5 458 | 5 184 |  |
| Victoria | 3 575 | 3 672 | 3 623 | 3 611 | 3 878 | 4 413 |  |
| Queensland | 2 939 | 3 269 | 3 155 | 3 093 | 3 199 | 3 425 |  |
| South Australia | 1 334 | 1 362 | 1 395 | 1 460 | 1 334 | 1 353 |  |
| Western Australia | 1 689 | 1 668 | 1 706 | 1 708 | 1 809 | 2 185 |  |
| Tasmania | 256 | 268 | 276 | 311 | 321 | 320 |  |
| Northern Territory | 262 | 239 | 211 | 222 | 235 | 280 |  |
| Australian Capital Territory | 483 | 553 | 572 | 571 | 509 | 527 |  |
| Australia | 15 354 | 15 973 | 16 307 | 16 525 | 16 743 | 17 686 |  |
Percentage changes from previous year (%) |  |
|  |
| New South Wales | 7.0 | 2.5 | 7.8 | 3.2 | -2.3 | -5.0 |  |
| Victoria | 2.6 | 2.7 | -1.3 | -0.3 | 7.4 | 13.8 |  |
| Queensland | 10.0 | 11.2 | -3.5 | -2.0 | 3.4 | 7.1 |  |
| South Australia | 6.7 | 2.1 | 2.4 | 4.7 | -8.6 | 1.5 |  |
| Western Australia | 3.2 | -1.3 | 2.3 | 0.1 | 5.9 | 20.8 |  |
| Tasmania | 4.1 | 4.9 | 2.9 | 12.5 | 3.1 | -0.3 |  |
| Northern Territory | 4.5 | -8.7 | -11.9 | 5.3 | 6.1 | 18.8 |  |
| Australian Capital Territory | 6.0 | 14.5 | 3.3 | -0.2 | -10.8 | 3.4 |  |
| Australia | 6.0 | 4.0 | 2.1 | 1.3 | 1.3 | 5.6 |  |
|  |
| (a) At basic prices. |
| (b) Reference year for chain volume measures is 2004-05. |
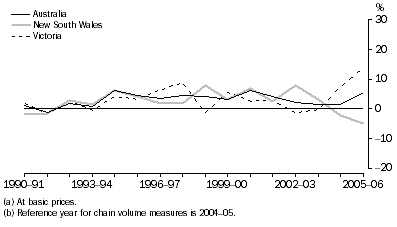
Personal and other services gross value added(a), Chain volume measures(b)-Percentage changes

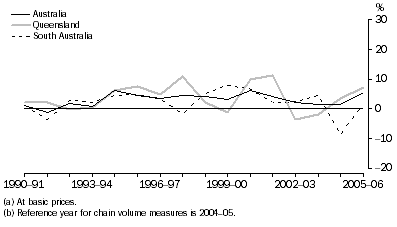
Personal and other services gross value added(a), Chain volume measures(b)-Percentage changes

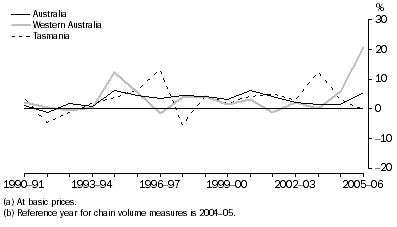
Personal and other services gross value added(a), Chain volume measures(b)-Percentage changes

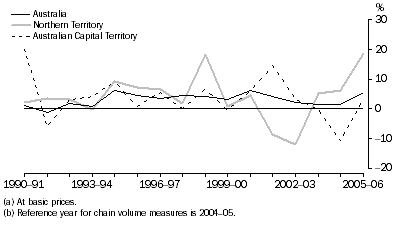
Personal and other services gross value added(a), Chain volume measures(b)-Percentage changes

In 2005-06, New South Wales and Tasmania experienced negative growth whereas Victoria, Western Australia and the Northern Territory had strong growth of 13.8%, 20.8% and 18.8% respectively, reflecting increases in both private and public expenditure.
Personal and other services gross value added, State shares - Current prices |
|  |
 | 1989-90 | 1994-95 | 1999-00 | 2003-04 | 2004-05 | 2005-06 |  |
 | % | % | % | % | % | % |  |
|  |
| New South Wales | 39.2 | 34.7 | 34.1 | 32.8 | 32.6 | 31.9 |  |
| Victoria | 22.5 | 22.2 | 22.5 | 22.6 | 23.2 | 21.8 |  |
| Queensland | 12.7 | 16.1 | 18.5 | 19.2 | 19.1 | 21.1 |  |
| South Australia | 9.8 | 9.8 | 8.2 | 8.2 | 8.0 | 7.8 |  |
| Western Australia | 9.3 | 10.9 | 10.3 | 10.7 | 10.8 | 10.9 |  |
| Tasmania | 2.3 | 2.0 | 1.9 | 2.0 | 1.9 | 2.1 |  |
| Northern Territory | 1.1 | 1.3 | 1.4 | 1.4 | 1.4 | 1.4 |  |
| Australian Capital Territory | 3.1 | 3.1 | 3.0 | 3.1 | 3.0 | 3.0 |  |
| Australia | 100.0 | 100.0 | 100.0 | 100.0 | 100.0 | 100.0 |  |
|  |
New South Wales, Victoria and Queensland accounted for almost 75% of total Australian Personal and other services GVA in 2005-06. New South Wales lost share steadily throughout the time series, moving from 39.2% in 1989-90 to 31.9% in 2005-06. Queensland increased its share from 12.7% in 1989-90 to 21.1% in 2005-06. Victoria, Tasmania, the Northern Territory and the Australian Capital Territory had quite stable shares throughout the time series.
 Print Page
 Print All