TECHNICAL NOTE
RELIABILITY OF THE ESTIMATES
1 Two types of error are possible in an estimate based on a sample survey: sampling error and non-sampling error. Estimates derived from models, including the NCI method, are also subject to prediction error and simulation variance. The sampling error is a measure of the variability that occurs by chance because a sample, rather than the entire population, is surveyed. Since the estimates in this publication are based on information obtained from occupants of a sample of dwellings they are subject to sampling variability; that is they may differ from the figures that would have been produced if all dwellings had been included in the survey. One measure of the likely difference is given by the standard error (SE). There are about two chances in three that a sample estimate will differ by less than one SE from the figure that would have been obtained if all dwellings had been included, and about 19 chances in 20 that the difference will be less than two SEs.
2 Another measure of the likely difference is given by the Margin of Error (MoE). The MoE describes the distance (or margin) from the estimate that the ‘true’ value will lie within at a given confidence level. Confidence levels typically used are 90%, 95% and 99%. For example, at the 95% confidence level the MoE indicates that there are about 19 chances in 20 that the estimate will differ by less than the specified MoE from the population value (the figure obtained if all dwellings had been enumerated). The 95% MoE is calculated as 1.96 multiplied by the SE.
3 The MoEs in this publication are calculated at the 95% confidence level. This can easily be converted to a 90% confidence level by multiplying the MoE by

or to a 99% confidence level by multiplying by a factor of

4 A confidence interval expresses the sampling error as a range in which the population value is expected to lie at a given level of confidence. The confidence interval can easily be constructed from the MoE of the same level of confidence by taking the estimate plus or minus the MoE of the estimate. Two types of error are possible in an estimate based on a sample survey: sampling error and non-sampling error.
5 The imprecision due to sampling variability, which is measured by the SE, should not be confused with inaccuracies that may occur because of imperfections in reporting by interviewers and respondents and errors made in coding and processing of data. Inaccuracies of this kind are referred to as the non-sampling error, and they may occur in any enumeration, whether it be in a full count or only a sample. In practice, the potential for non-sampling error adds to the uncertainty of the estimates caused by sampling variability. However, it is not possible to quantify the non-sampling error.
6 Prediction error is the variability attributed to the statistical accuracy of the NCI model used in this publication, including bias due to specification of the model. Simulation error is the variability due to simulating different random effects in order to generate usual distribution intakes. Although every effort is made to ensure an appropriate model specification is used, through external literature research and statistical testing, these errors are not quantified and also add to the uncertainty of the estimates.
COMPARISON OF ESTIMATES
8 Published estimates may also be used to calculate the difference between two survey estimates. Such an estimate is subject to sampling error. The sampling error of the difference between two estimates depends on their SEs and the relationship (correlation) between them. An approximate SE of the difference between two estimates (x-y) may be calculated by the following formula:

9 While the above formula will be exact only for differences between separate and uncorrelated (unrelated) characteristics of sub-populations, it is expected that it will provide a reasonable approximation for all differences likely to be of interest in this publication.
EXAMPLE OF INTERPRETATION OF SAMPLING ERROR
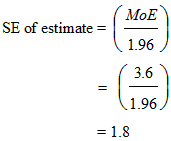
10 Standard errors can be calculated using the MoE. For example the MoE for the estimate of the proportion of females aged 51-70 years whose usual daily proportion of energy from free sugars was greater than or equal to 10% is +/- 3.6 percentage points. The SE is calculated by:

11 There are about 19 chances in 20 that the estimate of the proportion of females aged 51-70 years whose usual daily proportion of energy from free sugars was greater than or equal to 10% is +/- 3.6 percentage points from the population value.
12 Similarly, there are about 19 chances in 20 that the proportion of females aged 51-70 years whose usual daily proportion of energy from free sugars was greater than or equal to 10% is within the confidence interval of 31.6% to 38.8%.
SIGNIFICANCE TESTING
13 For comparing estimates between surveys or between populations within a survey it is useful to determine whether apparent differences are 'real' differences between the corresponding population characteristics or simply the product of differences between the survey samples. One way to examine this is to determine whether the difference between the estimates is statistically significant. This is done by calculating the standard error of the difference between two estimates (x and y) and using that to calculate the test statistic using the formula below:
 where SE(x-y) is given in 8 above.
14 If the value of the statistic is greater than 1.96 then we may say there is good evidence of a statistically significant difference at 95% confidence levels between the two populations with respect to that characteristic. Otherwise, it cannot be stated with confidence that there is a real difference between the populations.
 Print Page
 Print All