Australian Health Survey: Biomedical Results for Nutrients

Latest release

Presents information on selected biomarkers for nutrition, including iodine, folate, Vitamin B12 and iron

Reference period
2011-12
Released
11/12/2013
Next release Unknown
First release

Key findings

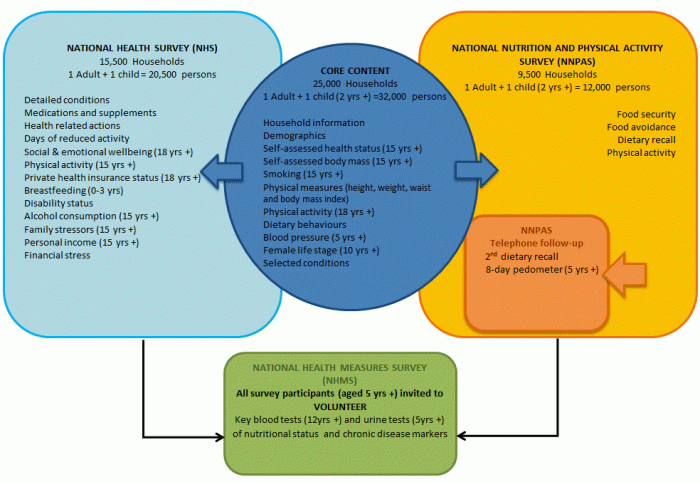
This publication is the second release of information from the National Health Measures Survey (NHMS), the biomedical component of the 2011–13 Australian Health Survey (AHS). Around 11,000 respondents aged 5 years and over across Australia voluntarily provided blood and/or urine samples, which were tested for a range of chronic disease and nutrient biomarkers. This publication focuses on the test results for nutrients, including folate, iodine, Vitamin B12, iron and Vitamin D. More detailed data for each of these nutrients is available in the tables in the Data downloads section below.

Iodine

  • The World Health Organization (WHO) considers a population iodine deficient if the median urinary iodine concentration is less than 100 μg/L. They also recommended that no more than 20% of the population have iodine concentrations below 50 μg/L.
  • The NHMS results showed that the Australian population was iodine sufficient in 2011–12, with a population median of 124.0 μg/L. Likewise, 12.8% had a concentration less than 50 μg/L.
  • Iodine levels varied across Australia, with adults in Western Australia having the highest median iodine levels in 2011–12 (157.4 μg/L) and Tasmanians the lowest (108.0 μg/L).
     

Women of childbearing age

  • The vast majority of women of childbearing age had sufficient folate levels in 2011–12, which is important for preventing neural tube defects (NTDs) in babies, most notably spina bifida. Overall, less than 1% of women aged 16–44 years had red cell folate levels in the at risk range for NTDs (less than 906 nmol/L).
  • Women aged 16–44 years also had adequate levels of Vitamin B12 in 2011–12, with an average of 359.7 pmol/L, which is well above the WHO cut-off for Vitamin B12 deficiency (150 pmo/L).
  • However, levels of iodine were relatively low for women of childbearing years. In 2011–12, one in every five (18.3%) women of childbearing age had an iodine deficiency (defined as less than 50 µg/L) and nearly two thirds (62.2%) had an iodine level less than 150 µg/L, which is the recommended level for all women who are pregnant, breastfeeding or considering pregnancy.
     

Vitamin D

  • Just under one in four Australian adults (23%) had a Vitamin D deficiency, which comprised 17% with a mild deficiency, 6% with a moderate deficiency and less than 1% with a severe deficiency.
  • Vitamin D levels varied considerably by season, with rates of deficiency being much lower in summer (14%) and much higher in winter (36%).
  • In winter, rates of Vitamin D deficiency were particularly high in the south eastern states of Victoria (49%), ACT (49%) and Tasmania (43%) compared with the northern states of Queensland (15%) and the Northern Territory (17%).
  • One in twenty Australian adults (5%) were taking Vitamin D supplements in 2011–12. As expected, those who took Vitamin D supplements had lower levels of Vitamin D deficiency than those who did not take supplements (7% compared with 23%).

About the National Health Measures Survey

The 2011–13 Australian Health Survey (AHS) is the largest and most comprehensive health survey ever conducted in Australia. The survey, conducted throughout Australia, collected a range of information about health related issues, including health status, risk factors, health service usage and medications. In 2011–13, the AHS incorporated the first ABS biomedical collection, the National Health Measures Survey (NHMS). It involved the collection of a range of blood and urine tests from over 11,000 participants across Australia, which were then tested for various chronic disease and nutrient biomarkers.

The AHS also included an additional representative sample of Aboriginal and Torres Strait Islander people. The National Aboriginal and Torres Strait Islander Health Measures Survey (NATSIHMS) will provide the first biomedical results for Aboriginal and Torres Strait Islander people aged 18 years and over at the population level and provides a unique opportunity to compare results with the non-Indigenous population. Results for NATSIHMS will be released in the second half of 2014.

This publication is the second release of information from the NHMS. It focusses on nutrient biomarkers, including folate, iodine, Vitamin B12 and iron. Information on Vitamin D will be released in 2014.

The NHMS has been made possible by additional funding from the Australian Government Department of Health and Ageing as well as the National Heart Foundation of Australia, and the contributions of these two organisations to improving health information in Australia through quality statistics are greatly valued.

The 2011–13 AHS, and particularly the NHMS component, was developed with the assistance of several advisory groups and expert panels. Members of these groups were drawn from Commonwealth and state/territory government agencies, non-government organisations, relevant academic institutions and clinicians. The valuable contributions made by members of these groups are greatly appreciated.

Finally, the success of the 2011–13 AHS was dependent on the very high level of cooperation received from the Australian public. Their continued cooperation is very much appreciated; without it, the range of statistics published by the ABS would not be possible. Information received by the ABS is treated in strict confidence as required by the Census and Statistics Act 1905.

The structure of the Australian Health Survey

This publication is one of several ABS releases for the 2011–13 Australian Health Survey (AHS) and is the second publication of biomedical results.

The AHS is the largest, most comprehensive health survey ever conducted in Australia. It combines the existing ABS National Health Survey (NHS) and the National Aboriginal and Torres Strait Islander Health Survey together with two new elements - a National Nutrition and Physical Activity Survey (NNPAS) and a National Health Measures Survey (NHMS).

The following diagram shows how the various elements combine to provide comprehensive health information for the overall Australian population. The content for each component survey is listed along with the ages of respondents for which topics were collected.

Structure of the 2011-13 Australian Health Survey

Venn type diagram showing the components and content of the Australian Health Survey

Structure of the 2011-13 Australian Health Survey

A Venn diagram like image showing the components, flow and content of the Australian Health Survey (AHS). The Venn diagram comprises of 4 components: The first component relates to the centre circle with arrows pointing left and right. This circle provides information on the AHS Core Content. During this part of the survey, a total of 25,000 households and 32,000 persons were surveyed based on: Household information, Demographics, Self-assessed health status (persons who were 15 years or over were counted), Self-assessed body mass (persons who were 15 years or over were counted), Smoking (persons who were 15 years or over were counted), Physical measures (including: height, weight, waist and Body Mass Index), Physical activity (persons who were 18 years or over were counted), Dietary behaviours blood pressure (persons who were 5 years or over were counted), Female life stage (persons who were 10 years or over were counted), and Selected conditions. The second component relates to the left arrow, where it provides information on the 15,500 households who were surveyed during the National Health Survey (NHS). A total of 20,500 persons were surveyed based on: Detailed conditions, Medication and supplements, Health related actions, Days of reduced activity, Social and emotional wellbeing (persons who were 18 years or over were counted), Physical activity (persons who were 15 years or over were counted), Private health insurance status (persons who were 18 years or over were counted), Breastfeeding (persons who were between the age of 0-3 were counted), Disability status, Alcohol consumption (persons who were 15 years or over were counted), Family stressors (persons who were over 15 years or over were counted), Personal income persons who were 15 years or over were counted), and financial stress. From this component, there is a black arrow which points to the fourth, and final component. The third component relates to the right arrow, where it provides information on the 9,500 households who were surveyed during the National Nutrition Activity Survey (NNPAS). A total of 12,000 persons were surveyed based on: Food security, Food avoidance, Dietary recall, and Physical activity. This component also includes a box within this square, which provides information on the NNPAS telephone follow-up comprising of: 2nd dietary recall, and 8-day pedometer (persons who were 5 years or over were counted). From this component, there is a black arrow which points to the fourth, and final component. The final component relates to the green box which the second and third component refer to. This component relates to the information obtained from the 11,000 persons, who were 5 years or older, surveyed during the National Health Measures Survey (NHMS). The 11,000 volunteers were surveyed based on: Key blood tests (persons who were 12 years or older were counted) and urine tests (persons who were 5 years or older were counted) of nutritional status and chronic disease markers.

As shown in the above diagram, the AHS is made up of 3 components:

  • the National Health Survey (NHS);
  • the National Nutrition and Physical Activity Survey (NNPAS); and
  • the National Health Measures Survey (NHMS)
     

All people selected in the AHS were selected in either the NHS or the NNPAS, however data items in the 'Core' were common to both surveys and therefore information for these data items is available for all persons in the AHS. All people aged 5 years and over were then invited to participate in the voluntary NHMS. This sample design allows comparisons across a wide range of information about people's health, as well as use of this information in the estimation process.

The NHMS had approximately 11,000 participants aged 5 years and over across Australia. Respondents voluntarily provided blood and urine samples, which were then analysed for specific chronic disease and nutrient biomarkers. See Appendix A for the full list of tests conducted.

Information for Aboriginal and Torres Strait Islander people

The AHS also includes an additional representative sample of around 13,000 Aboriginal and Torres Strait Islander people, which was collected between April 2012 and July 2013. This is a separate collection of Aboriginal and Torres Strait Islander people living in remote and non-remote areas, including discrete communities. The structure is the same as outlined above, comprised of the National Aboriginal and Torres Strait Islander Health Survey component, the National Aboriginal and Torres Strait Islander Nutrition and Physical Activity Survey component and the National Aboriginal and Torres Strait Islander Health Measures Survey component. The Aboriginal and Torres Strait Islander Health Measures Survey will provide the first biomedical results for Aboriginal and Torres Strait Islander people at the population level and provides a unique opportunity to compare results with the non-Indigenous population.

The first results from this survey were released in November 2013. See Australian Aboriginal and Torres Strait Islander Health Survey: First Results, Australia (cat. no. 4727.0.55.001). The remainder of the results will be released progressively into 2014. For more information on future releases see Release schedule.

Release schedule

Results from the Australian Health Survey have been released progressively from October 2012 and will continue into 2015. Please see the Australian Health Survey: Users' Guide, 2011-13 (cat. no. 4363.0.55.001) and the Australian Aboriginal and Torres Strait Islander Health Survey: Users' Guide, 2012-13 (cat. no .4727.0.55.002) for more information on the release schedule.

Data downloads

Table 1: Nutrient biomarkers by age and then sex, means and medians

Table 1 This update clarifies the unit of measurement in the Relative Standard Errors worksheet. No data have been changed.

Table 2: Nutrient biomarkers by state and territory, means and medians

Table 2 This update clarifies the unit of measurement in the Relative Standard Errors worksheet. No data have been changed.

Table 3: Nutrient biomarkers by remoteness and SEIFA, means and medians

Table 3 This update clarifies the unit of measurement in the Relative Standard Errors worksheet. No data have been changed.

Table 4: Nutrient biomarkers by selected health risk factors, means and medians

Table 4 This update clarifies the unit of measurement in the Relative Standard Errors worksheet. No data have been changed.

Table 5: Nutrient biomarkers by ranges

Table 6: Nutrient biomarkers for women aged 16-44 years, means and medians

Table 6 This update clarifies the unit of measurement in the Relative Standard Errors worksheet. No data have been changed.

Table 7: Nutrient biomarkers for women aged 16-44 years by ranges

Table 8: Vitamin D by season and state and territory

Table 9: Selected health conditions by Vitamin D status

Table 10: Vitamin D by selected population characteristics

Table 11: Vitamin D supplements by selected population characteristics

All data cubes

History of changes

Show all

24/08/2015 - This update clarifies the unit of measurement in the Relative Standard Errors worksheets of datacubes 1-4 and 6. No data have been changed.

27/04/2015 - Amendment made to release schedule page to direct users to the release schedules in the AATSIHS and AHS Users' Guide.

11/07/2014 - This update corrects the unit label for Vitamin D Interquartile range in datacubes 1-4 and 6. No data have been changed.

15/04/2014 - Feature article and datacubes on Vitamin D released. Replacement of datacubes 1 to 7 to include the new Vitamin D information and to correct minor formatting issues.

Previous catalogue number

This release previously used catalogue number 4364.0.55.006.

Back to top of the page