PRODUCTIVITY
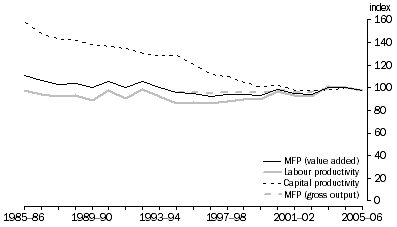
Figure 14.1 presents labour productivity, capital productivity and multifactor productivity (MFP) measures for Cultural & recreational services. Between 1985-86 and 2005-06 there was no growth in labour productivity, while MFP on a value added basis recorded, on average, negative growth of 0.6% per year, compared to market sector MFP growth of 1.2% per year. Capital productivity also declined, falling 2.4% per year between 1985-86 and 2005-06.
The gross output based measure of MFP for the period 1994-95 to 2004-05 is also shown in figure 14.1. The figure shows little difference in the two MFP measures, except that the gross output based MFP growth was flatter reflecting the influence of intermediate inputs.
14.1 Culture & recreational services MFP, labour productivity and capital productivity, (2004-05 = 100)

 Print Page
 Print All