ACCOMMODATION, CAFES AND RESTAURANTS
Definition and scope
The Accommodation, cafes and restaurants industry includes all units mainly engaged in providing hospitality services in the form of accommodation, meals and drinks.
ANZSIC Division G, Accommodation, cafes and restaurants, consists of one sub-division:
- Accommodation, cafes and restaurants (sub-division 57).
Summary of GSP(P) sources and methods
The methodology for Accommodation, cafes and restaurants uses an output indicator approach to compile state by industry GVA estimates. Output volumes are derived using quantity revaluation for the state output of Accommodation and price deflation for Cafes and restaurants. The output volumes then form the basis upon which volume measures of value added are derived at the division level.
For accommodation, quantity data (guest nights) and turnover data for hotels, motels, serviced apartments, caravan parks and holiday flats are sourced from the ABS Tourist Accommodation, Australia (cat. no. 8635.0).
Cafes and restaurants current price estimates are sourced from the ABS publication Retail Trade, Australia by state. Price deflators are sourced from the ABS CPI by capital city.
The state output indicators are used to derive volume measures of GVA for Accommodation, cafes and restaurants. The state volume GVAs are benchmarked to the annual national industry volume GVA.
Results for Accommodation, cafes and restaurants
Accommodation, cafes and restaurants gross value added(a), Chain volume measures(b) |
|  |
 | 2000-01 | 2001-02 | 2002-03 | 2003-04 | 2004-05 | 2005-06 |  |
Values ($m) |  |
|  |
| New South Wales | 6 569 | 6 562 | 6 727 | 6 873 | 7 439 | 7 400 |  |
| Victoria | 3 051 | 3 171 | 3 091 | 3 407 | 3 686 | 3 755 |  |
| Queensland | 4 221 | 3 979 | 4 209 | 4 683 | 4 682 | 5 187 |  |
| South Australia | 1 043 | 1 104 | 1 230 | 1 262 | 1 218 | 1 238 |  |
| Western Australia | 1 300 | 1 368 | 1 469 | 1 507 | 1 492 | 1 528 |  |
| Tasmania | 359 | 337 | 363 | 397 | 417 | 416 |  |
| Northern Territory | 275 | 259 | 246 | 235 | 269 | 287 |  |
| Australian Capital Territory | 416 | 418 | 438 | 414 | 405 | 393 |  |
| Australia | 17 166 | 17 158 | 17 735 | 18 732 | 19 608 | 20 204 |  |
Percentage changes from previous year (%) |  |
|  |
| New South Wales | 6.3 | -0.1 | 2.5 | 2.2 | 8.2 | -0.5 |  |
| Victoria | -1.8 | 3.9 | -2.5 | 10.2 | 8.2 | 1.9 |  |
| Queensland | 5.4 | -5.7 | 5.8 | 11.3 | - | 10.8 |  |
| South Australia | 10.4 | 5.8 | 11.4 | 2.6 | -3.4 | 1.6 |  |
| Western Australia | -1.6 | 5.3 | 7.4 | 2.6 | -1.0 | 2.4 |  |
| Tasmania | -4.5 | -6.2 | 7.8 | 9.4 | 5.0 | -0.2 |  |
| Northern Territory | 2.9 | -5.7 | -5.0 | -4.7 | 14.7 | 6.6 |  |
| Australian Capital Territory | 13.3 | 0.3 | 4.9 | -5.5 | -2.2 | -2.9 |  |
| Australia | 4.2 | -0.1 | 3.4 | 5.6 | 4.7 | 3.0 |  |
|  |
| - nil or rounded to zero (including null cells) |
| (a) At basic prices. |
| (b) Reference year for chain volume measures is 2004-05. |
Accommodation, cafes and restaurants gross value added(a), Chain volume measures(b)-Percentage changes

Accommodation, cafes and restaurants gross value added(a), Chain volume measures(b)-Percentage changes

Accommodation, cafes and restaurants gross value added(a), Chain volume measures(b)-Percentage changes

Accommodation, cafes and restaurants gross value added(a), Chain volume measures(b)-Percentage changes

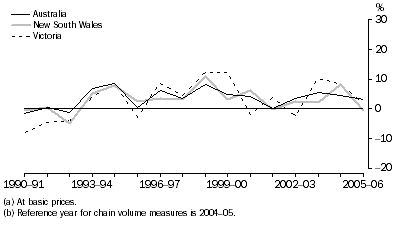
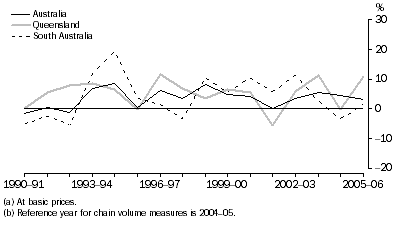
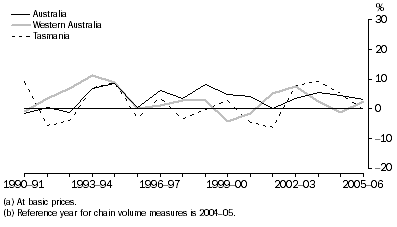
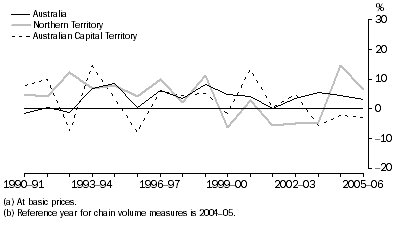
New South Wales had a long period of growth from 1993-94 to 2004-05 with only one year of minor negative growth in 2001-02. Victoria experienced strong growth in the late 1990's followed by a period of low or negative growth. Queensland has shown continual growth throughout the time series, with only one year of negative growth in 2001-02. South Australia and Tasmania experienced strong growth in 1993-94 and 1994-95 which coincided with the introduction of gaming machines in clubs and hotels in these states. Western Australia and the Northern Territory maintained continuous growth between 1989-90 and 1998-99. The Australian Capital Territory's growth rate has been variable throughout the time series, with the latest three years all showing negative growth. In 2005-06, all states had positive growth except New South Wales, Tasmania and the Australian Capital Territory. Queensland and the Northern Territory were the only states to have growth above the national growth of 3.0%, at 10.8% and 6.6% respectively.
Accommodation, cafes and restaurants gross value added, State shares - Current prices |
|  |
 | 1989-90 | 1994-95 | 1999-00 | 2003-04 | 2004-05 | 2005-06 |  |
 | % | % | % | % | % | % |  |
|  |
| New South Wales | 42.1 | 40.7 | 39.9 | 38.8 | 37.9 | 36.9 |  |
| Victoria | 18.1 | 18.4 | 18.1 | 18.5 | 18.8 | 18.7 |  |
| Queensland | 19.7 | 21.6 | 22.2 | 23.0 | 23.9 | 24.7 |  |
| South Australia | 7.5 | 6.2 | 6.7 | 6.3 | 6.2 | 6.4 |  |
| Western Australia | 7.7 | 7.3 | 7.7 | 7.6 | 7.6 | 7.8 |  |
| Tasmania | 2.2 | 2.4 | 2.0 | 2.1 | 2.1 | 2.1 |  |
| Northern Territory | 1.3 | 1.5 | 1.5 | 1.4 | 1.4 | 1.5 |  |
| Australian Capital Territory | 1.6 | 1.9 | 1.9 | 2.2 | 2.1 | 1.9 |  |
| Australia | 100.0 | 100.0 | 100.0 | 100.0 | 100.0 | 100.0 |  |
|  |
The share for New South Wales has decreased over the time series from 42.1% in 1989-90 to 36.9% in 2005-06. Queensland has been the main state to increase its share, rising from 19.7% in 1989-90 to 24.7% in 2005-06.
 Print Page
 Print All