WHOLESALE TRADE
Definition and scope
The Wholesale trade industry includes those units mainly engaged in the resale (as agents or principals) of new or used goods to businesses or to institutional (including Government) users.
ANZSIC Division F, Wholesale trade, consists of three sub-divisions:
- Basic material wholesaling (sub-division 45)
- Machinery and motor vehicle wholesaling (sub-division 46)
- Personal and household good wholesaling (sub-division 47).
Summary of GSP(P) sources and methods
The methodology for Wholesale trade uses an output indicator approach to compile state by industry GVA estimates. Output volumes are derived by deflating total Wholesale trade output by state at a division level. The output volumes then form the basis upon which volume measures of value added are derived at the division level.
The current price estimates of Wholesale trade output are obtained from QBIS. Since QBIS data are only available from 2000-01, Retail sales output (turnover) from ABS Retail Trade, Australia (cat. no. 8501.0) has been used as a proxy to compile historical estimates. Quarterly state output estimates are summed to derive annual output estimates.
The current price output estimates are priced deflated using the national Wholesale trade deflator from 2000-01. Prior to that, the Retail trade deflator by state is used.
The state output indicators are used to derive volume measures of GVA for Wholesale Trade. The state volume GVAs are benchmarked to the annual national industry volume GVA.
Results for Wholesale trade
Wholesale trade gross value added(a), Chain volume measures(b) |
|  |
 | 2000-01 | 2001-02 | 2002-03 | 2003-04 | 2004-05 | 2005-06 |  |
Values ($m) |  |
|  |
| New South Wales | 15 806 | 15 911 | 15 637 | 15 250 | 15 859 | 15 939 |  |
| Victoria | 9 371 | 9 390 | 10 858 | 12 057 | 12 276 | 12 171 |  |
| Queensland | 6 504 | 7 069 | 7 131 | 7 488 | 7 793 | 8 101 |  |
| South Australia | 2 013 | 2 285 | 2 354 | 2 458 | 2 480 | 2 528 |  |
| Western Australia | 2 949 | 3 190 | 3 407 | 3 899 | 4 083 | 4 815 |  |
| Tasmania | 503 | 458 | 500 | 523 | 557 | 611 |  |
| Northern Territory | 243 | 229 | 250 | 233 | 232 | 292 |  |
| Australian Capital Territory | 324 | 312 | 309 | 313 | 345 | 352 |  |
| Australia | 37 435 | 38 433 | 40 260 | 42 174 | 43 625 | 44 886 |  |
Percentage changes from previous year (%) |  |
|  |
| New South Wales | -0.6 | 0.7 | -1.7 | -2.5 | 4.0 | 0.5 |  |
| Victoria | -5.3 | 0.2 | 15.6 | 11.0 | 1.8 | -0.9 |  |
| Queensland | 7.0 | 8.7 | 0.9 | 5.0 | 4.1 | 4.0 |  |
| South Australia | -5.7 | 13.5 | 3.1 | 4.4 | 0.9 | 2.0 |  |
| Western Australia | 6.4 | 8.2 | 6.8 | 14.5 | 4.7 | 17.9 |  |
| Tasmania | -11.1 | -8.9 | 9.3 | 4.5 | 6.5 | 9.7 |  |
| Northern Territory | -14.1 | -5.8 | 8.8 | -6.6 | -0.5 | 25.9 |  |
| Australian Capital Territory | 14.1 | -3.8 | -0.8 | 1.1 | 10.3 | 2.0 |  |
| Australia | -0.4 | 2.7 | 4.8 | 4.8 | 3.4 | 2.9 |  |
|  |
| (a) At basic prices. |
| (b) Reference year for chain volume measures is 2004-05. |
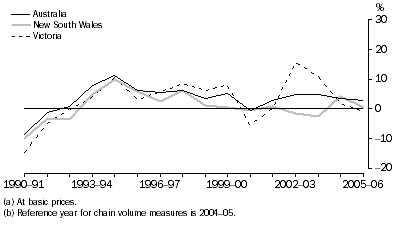
Wholesale trade gross value added(a), Chain volume measures(b)-Percentage changes

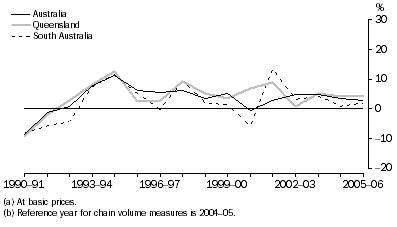
Wholesale trade gross value added(a), Chain volume measures(b)-Percentage changes

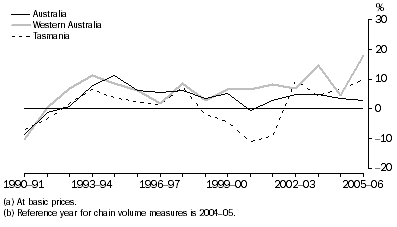
Wholesale trade gross value added(a), Chain volume measures(b)-Percentage changes

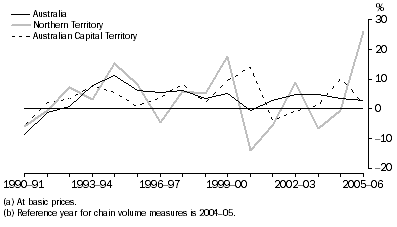
Wholesale trade gross value added(a), Chain volume measures(b)-Percentage changes

From 2002-03 to 2004-05, most states exhibited positive growth rates of varying degrees except for New South Wales, the Northern Territory and the Australian Capital Territory. In 2005-06, Victoria had negative growth whereas all other states had positive growth. Western Australia and the Northern Territory recorded growth rates of 17.9% and 25.9% respectively which reflected the strong demand for commodities in mining and industrial materials in these states.
Wholesale trade gross value added, State shares - Current prices |
|  |
 | 1989-90 | 1994-95 | 1999-00 | 2003-04 | 2004-05 | 2005-06 |  |
 | % | % | % | % | % | % |  |
|  |
| New South Wales | 37.1 | 38.1 | 38.1 | 36.6 | 36.4 | 35.8 |  |
| Victoria | 29.7 | 26.7 | 27.5 | 28.2 | 28.1 | 28.8 |  |
| Queensland | 14.8 | 15.6 | 17.1 | 17.8 | 17.9 | 17.8 |  |
| South Australia | 6.6 | 6.2 | 5.9 | 5.7 | 5.7 | 5.6 |  |
| Western Australia | 8.7 | 10.3 | 8.7 | 9.3 | 9.4 | 9.3 |  |
| Tasmania | 1.6 | 1.6 | 1.3 | 1.3 | 1.3 | 1.3 |  |
| Northern Territory | 0.6 | 0.6 | 0.6 | 0.5 | 0.5 | 0.5 |  |
| Australian Capital Territory | 1.0 | 0.8 | 0.9 | 0.8 | 0.8 | 0.8 |  |
| Australia | 100.0 | 100.0 | 100.0 | 100.0 | 100.0 | 100.0 |  |
|  |
The three largest states, New South Wales, Victoria and Queensland, accounted for over 80% of Australian Wholesale trade GVA in 2005-06. The state shares have been fairly stable throughout the time series.
 Print Page
 Print All