|
|
|
The number of people living in Australia, together with their demographic characteristics and distribution across the country, has an important influence on many of the dimensions of progress mentioned in this publication. Similarly, many of the dimensions of progress influence the size and shape of Australia's population.
This commentary does not attempt to answer questions about whether, and to what extent, Australia's population should grow (indeed, these questions are the subject of national debate). Rather, it provides some contextual information about the population and explains some of the links between changes in population and dimensions of progress. |
Population size and trends
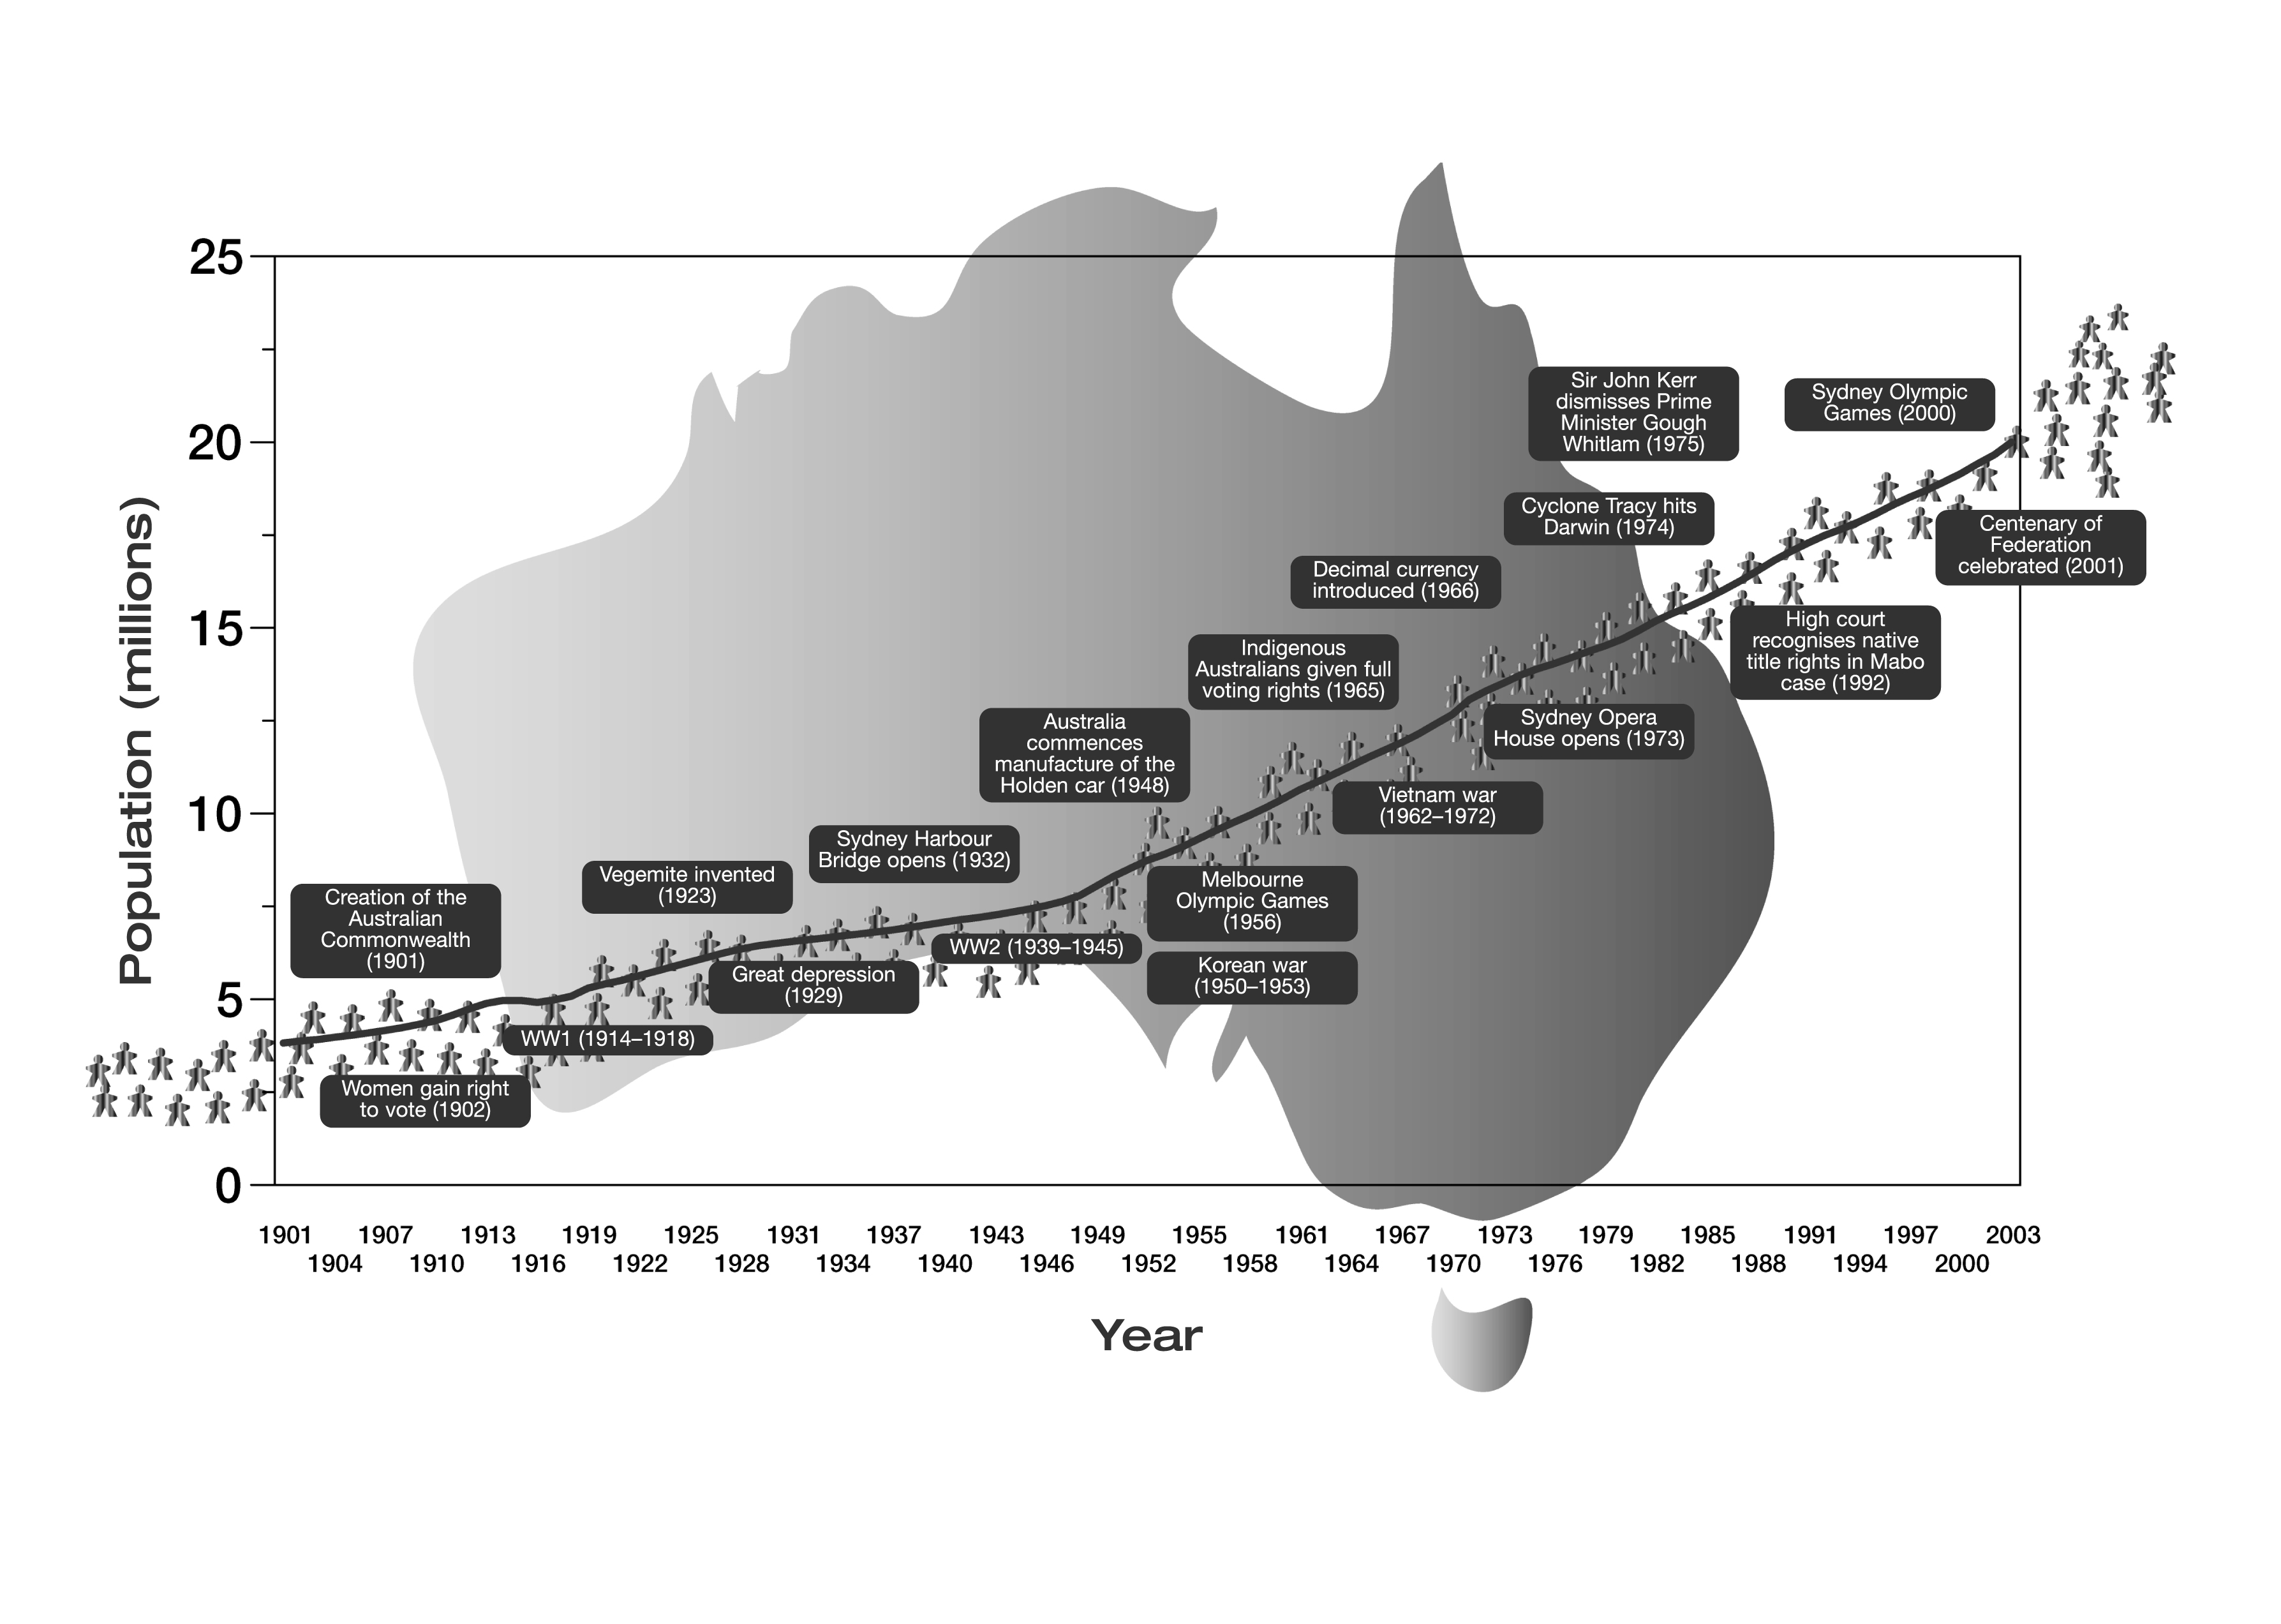
Australia's resident population at June 2003 was estimated at 19.9 million people - an increase of more than 16 million since 1901, when the population was recorded at 3.8 million. The natural increase in our population, defined as the excess of births over deaths, has been the main source of growth during this period. Another source of increase is net overseas migration.1
Since June 1993, Australia's population has increased by more than 2 million. However, the rate of growth over the decade has been, on average, markedly slower than growth rates in most previous decades.
Since the early 1960s, falling fertility has led to a drop in the rate of natural increase. In 1921, a woman could be expected to give birth to around 3.1 children in her lifetime. Twenty years later, the expected number of births as measured by the Total Fertility Rate (TFR) had declined to 2.25 children. Since then, fertility rates have fluctuated considerably, the highest being 3.55 in 1961. In 2002, Australia had a TFR of 1.75 babies per woman.2
This is well below the replacement level of 2.1 babies per woman, which is the number of babies a woman would have to have over her lifetime to replace herself and her partner.2
Population density - selected countries |
 | People per square kilometre |
|
| Australia | 2 |
| Canada | 3 |
| Italy | 190 |
| Japan | 336 |
| Korea | 476 |
| New Zealand | 14 |
| United Kingdom | 244 |
| United States of America | 29 |
|
| Source: OECD in Figures (2002). | |
Estimated resident population |
|
| Population | Increase |
| At 30 June | no. | % |
| 1993 | 17 667 093 | . . |
| 1994 | 17 854 738 | 1.06 |
| 1995 | 18 071 758 | 1.22 |
| 1996 | 18 310 714 | 1.32 |
| 1997 | 18 517 564 | 1.13 |
| 1998 | 18 711 271 | 1.05 |
| 1999 | 18 925 855 | 1.15 |
| 2000 | 19 153 380 | 1.2 |
| 2001 | 19 413 240 | 1.36 |
| 2002 | 19 662 781 | 1.17 |
| 2003 | 19 881 469 | 1.22 |
|
| Source: Australian Demographic Statistics cat. no. 3101.0. |
Population distribution
Australia is large in area. Compared with other countries, its population is small relative to its size. For every square kilometre of land there are only around two Australians. But this statistic hides the fact that 84% of the population is contained within the most densely populated 1% of the continent.
The majority of Australia's population is concentrated in two widely separated coastal regions. The larger of these is the east to south-east region, the smaller lies in the south-west parts of the continent.
New South Wales is the country's most populous state, accounting for one-third of the total population in 2003. Of all Australia's states and territories, the population of Queensland grew the fastest between 1993 and 2003 (by 22%), and the populations of Western Australia and the Northern Territory were next fastest, growing by 16% each. Tasmania had the slowest population growth over the period at about 1%.3
The percentage of Australians living in rural areas has also declined in recent years. The rural population includes people living on private rural properties, in very small communities, and bounded localities (population clusters of 200 to 999 people). In 1911, 43% of Australians lived in rural areas; this proportion had fallen to 14% by 1976 and has stayed around this level since. Technological, social and economic changes contributed to population decline in these areas.
Total fertility rates, 1922–2002(a)
Population age structure(a) - 1993 and 2003 |
| Age years | 1993
’000 people | 2003
’000 people | Change
% |
|
| 0-4 | 1,293 | 1,265 | -2.2 |
| 5-14 | 2,545 | 2,715 | 6.3 |
| 15-24 | 2,736 | 2,754 | 0.6 |
| 25-34 | 2,827 | 2,879 | 1.8 |
| 35-44 | 2,674 | 2,990 | 10.6 |
| 45-54 | 2,059 | 2,710 | 24.1 |
| 55-64 | 1,477 | 2,023 | 27.0 |
| 65-74 | 1,239 | 1,350 | 8.2 |
| 75-84 | 645 | 906 | 28.8 |
| 85+ | 172 | 290 | 40.5 |
| Total | 17,667 | 19,882 | 11.1 |
|
| (a) Includes ‘Other Territories’ in Australia from June 1994. Source: Australian Historical Population Statistics, cat. no.3105.0.65.001; and Australian Demographic Statistics cat. No. 3101.0. |
Population age and sex composition
The age structure of the population has changed significantly over the last century. A decline in birth rates, changes in migration patterns and increases in life expectancy have meant that children under 15 now make up a smaller proportion of the population. Conversely, in 1901 only 4% of the population was 65 or over whereas by June 2001 this figure had risen to over 12%.
The balance between men and women has also changed. In 1901 there were 110 men for every 100 women (in part due to the relatively high proportion of Australian immigrants who were male). This gap has closed. At June 2003, there were slightly fewer men than women in Australia (100 men for every 101 women).3
Aboriginal and Torres Strait Islander population
Historically, it has been difficult to measure accurately the size of Australia's Indigenous population. In the last two decades, the likelihood of people identifying themselves as Aboriginal or Torres Strait Islander has increased. This has been the result of changing social attitudes, political developments, improved statistical coverage and a broader definition of Indigenous origin. In June 2001, the total Indigenous population was estimated to be approximately 2% of Australia's total population - about 460,000.3
Links between population and progress
The size and shape of Australia's population influences, and is in turn influenced by, many aspects of progress considered in this publication. Some Australians believe the population should grow quickly to reach substantially higher levels by the end of this century - they point to the economic and other benefits not just of a larger population but also of a growing population.
Other Australians are of the view that our environment cannot sustain a significantly larger population and that economic progress will be generated mainly through productivity enhancements, rather than just through an increase in the scale of economic activities.
Two of the environmental arguments advanced for stabilising our population are:
- The limited amount of land suitable for agriculture.
- Our climate patterns, and in particular the limited amount of rainfall.
Arguments raised to counter these two views include the following:
- Australia already provides for more people than its own population. In the mid-1990s, for example, a rough calculation from the State of the Environment report estimated that we produce one-third of the world's wool, and that our agricultural exports feed about 55 million people (at Australian levels of consumption).4
- Some 70% of current water use is by agricultural industries, rather than directly by Australian households.
Where people live also has important effects. Concentrating people within an area can have localised environmental effects, such as air pollution in cities. The concentration of people in the coastal areas of south-eastern Australia has also resulted in relatively high rates of land clearing for urban development, together with the need to provide water, sewerage and landfill sites.
The population's geographic and age distribution also influences the labour market. Changes in the labour market, in turn, can influence the geographic distribution of the population, by encouraging people to move to where they can find employment.
The proportion of the population that is employed provides a broad indicator of the degree of economic dependency in Australia - the relative sizes of the total population and of that part of the population engaged in paid work. Economic dependency may increase owing to, say, a rise in the number of unemployed or the number of people past retirement age. Between 1991-92 and 2001-02, the proportion of the civilian Australian population that was employed rose from 56.3%
to 59.7%.5
The age distribution of the population contributes to the demand for health and aged care services, as do changing patterns of mortality, fertility and migration. In turn, the ageing of the population reflects the increase in life expectancy.
Current ABS population projections indicate that Australia's population could range between 23 and 31 million people by 2051, if various assumptions for fertility, mortality and net overseas migration were to hold.6 The population would have an older profile and there would be more non-working older people per working adult. The proportion of the total population aged between 15 and 64 could decline from 67% in 2002 to less than 60% in 2051, according to the
ABS projections.6
Milestone years for Australia’s millions(a) |
| Year attained | Population(b) |
|
| 1858 | 1 million |
| 1877 | 2 million |
| 1889 | 3 million |
| 1905 | 4 million |
| 1918 | 5 million |
| 1925 | 6 million |
| 1939 | 7 million |
| 1949 | 8 million |
| 1954 | 9 million |
| 1959 | 10 million |
| 1963 | 11 million |
| 1968 | 12 million |
| 1971 | 13 million |
| 1976 | 14 million |
| 1981 | 15 million |
| 1986 | 16 million |
| 1990 | 17 million |
| 1995 | 18 million |
| 1999 | 19 million |
| 2003 | 20 million |
|
(a) This table reports the milestone years of increments of one million people to Australia’s population that are reflected in the feature graph on opposite page.
(b) Population is a generic term intended to capture all the different methods of enumeration used from 1788 to the present day. Estimated Resident Population (ERP) is the current official method. ERP began in 1971. Before that census counts or other enumeration methods were used. Early population estimates were obtained through colonial ‘musters’ and, from 1828, through a series of relatively regular colonial censuses. |
|
| Source: Australia in Profile, cat. no. 2821 Demographic Trends, cat. no. 3102.0; Australian Social Trends, cat. no. 4102.0; Estimated Resident Population by Country of Birth, Age and Sex, Australia, cat. no. 3221.0; Population by Age and Sex, Australian States and Territories cat. no. 3201.0; and Year Book Australia, cat. no. 1301.0. |
Endnotes
1. Australian Bureau of Statistics 2003, Year Book Australia 2003, cat. no. 1301.0, ABS, Canberra.
2. Australian Bureau of Statistics 2003, Births Australia, 2002, cat. no. 3301.0, ABS, Canberra.
3. Australian Bureau of Statistics 2003, Australian Demographic Statistics 2003, cat. no. 3101.0, ABS, Canberra.
4. State of the Environment Advisory Council 1996, Australia - State of the Environment Report 1996, CSIRO Publishing, Melbourne.
5. Australian Bureau of Statistics 2001, Labour Force Australia, cat. no. 6202.0, ABS, Canberra.
6. Australian Bureau of Statistics 2003, Proportion in Working Ages Set to Decline, Media Release, cat. no. 3222.0, ABS, Canberra. ABS population projections use the estimated resident population at 30 June 2002 as a base population. Population projections are not predictions or forecasts. They simply show what would happen to Australia's population if a particular set of assumptions about future levels of births, deaths and net overseas migration were to hold for the next 50 to 100 years. The assumptions about levels of future fertility, mortality and migration are based on long-term trends, current debate, and possible future scenarios arising from research in Australia and elsewhere.
Counting Australia's millions
|
 Print Page
 Print All