HEALTH STATUS
Morbidity
The 2007-08 NHS found 75% of the Australian population reported one or more long-term conditions (i.e. conditions that have lasted, or are expected to last, for six months or more). In most cases, respondents were asked about conditions which had been medically diagnosed.
Among adults aged 18 years and over in 2007-08, women in general were more likely than men to report selected long-term conditions with the exception of total/partial hearing loss, back problems and diabetes (table 11.2). They have a longer life expectancy at birth, 83.5 years compared with 78.7 for men (based on statistics for 2006). This results in higher proportions of women in the older age groups where long-term conditions are common.
11.2 SELECTED LONG-TERM CONDITIONS(a)(b) - 2007-08 |
|
 | Males | Females | Persons |
| % | % | % |
|
| Long sightedness | 29.0 | 35.5 | 32.3 |
| Short sightedness | 25.0 | 31.0 | 28.1 |
| Arthritis | 16.9 | 22.6 | 19.8 |
| Back problems(c) | 18.3 | 17.1 | 17.7 |
| Hayfever & allergic rhinitis | 15.9 | 18.3 | 17.1 |
| Total/partial hearing loss | 16.8 | 9.3 | 13.0 |
| Hypertensive disease | 11.6 | 13.0 | 12.3 |
| Asthma | 7.8 | 11.7 | 9.8 |
| Diabetes mellitus | 6.0 | 4.4 | 5.1 |
|
| (a) Conditions which have lasted or are expected to last six months or more. |
| (b) Persons aged 18 years and over. |
| (c) Includes back pain, back problems n.e.c and disc disorders. |
| Source: ABS data available on request, 2007-08 National Health Survey. |
The most commonly reported long-term conditions were problems with eyesight affecting 60% of adults, including long and short sightedness (32% and 28% respectively), arthritis (20%), back problems (18%), hayfever and allergic rhinitis (17%), deafness (13%) hypertensive disease (12%), and asthma (10%).
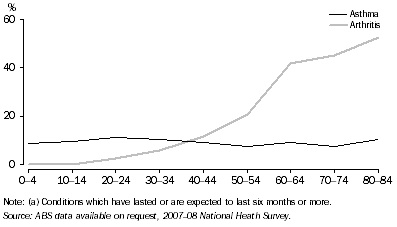
The most commonly reported long-term conditions among children and young adults were respiratory conditions (17% of children under 15 years and 28% of persons aged 15-24 years), with asthma being the most prevalent for children under 15 years of age (10%)(graph 11.3) and hayfever and allergic rhinitis for those aged 15-24 (17%).
While respiratory conditions were also common among people aged 65 years and over (29%), other conditions were more prevalent in this age group. Sight conditions, arthritis, hypertension and hearing loss were the most common long-term conditions among those aged 65 years and over.
11.3 SELECTED LONG-TERM CONDITIONS(a), By age 2007-08
Mortality
There were 137,854 deaths registered in 2007, consisting of 70,569 males and 67,285 females. The age-standardised death rate of 595 deaths per 100,000 population in 2007 was 4.6% lower than the corresponding rate of 624 in 1997. This is consistent with continuing improvements in life expectancy in Australia (see the
Population chapter).
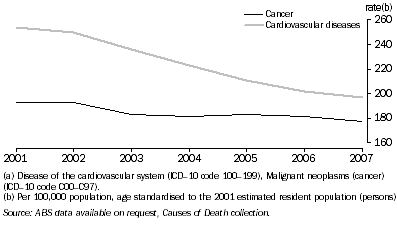
Malignant neoplasms (cancer) and diseases of the cardiovascular system, together account for almost two-thirds of all deaths. Over the ten years to 2007, death rates from cancer and diseases of the cardiovascular system have both declined, though the decline has been more substantial in death rates from diseases of the cardiovascular system (graph 11.4).
11.4 DEATH RATES FROM CARDIOVASCULAR DISEASE AND CANCER(a)
11.5 LEADING CAUSES OF DEATH 2007(a) |
|
| Rank(c) | Underlying Cause of Death | ICD-10 code | rate(b) |
MALES |
|
| 1 | Ischaemic heart disease | I20-I25 | 128 |
| 2 | Cerebrovascular disease | I60-I69 | 49 |
| 3 | Trachea and lung cancer | C34 | 46 |
| 4 | Chronic lower respiratory disease | J40-J47 | 33 |
| 5 | Prostate cancer | C61 | 31 |
| 6 | Dementia and Alzheimer's disease | F01, F03, G30 | 24 |
| 7 | Colorectal cancer | C18-C21 | 22 |
| 8 | Blood and lymph cancer | C81-C96 | 21 |
| 9 | Diabetes | E10-E14 | 20 |
| 10 | Suicide(d) | X60-X84 | 14 |
| All causes | | | 595 |
FEMALES |
|
| 1 | Ischaemic heart disease | I20-I25 | 71 |
| 2 | Cerebrovascular disease | I60-I69 | 47 |
| 3 | Dementia and Alzheimer's disease | F01, F03, G30 | 31 |
| 4 | Trachea and lung cancer | C34 | 24 |
| 5 | Breast cancer | C50 | 22 |
| 6 | Chronic lower respiratory disease | J40-J47 | 19 |
| 7 | Colorectal cancer | C18-C21 | 15 |
| 8 | Diabetes | E10-E14 | 14 |
| 9 | Diseases of the kidney and urinary system | N00-N99 | 12 |
| 10 | Heart failure | I50 | 11 |
| All causes | | | 486 |
|
| (a) Cause of death data for 2007 are subject to revision. |
| (b) Rate per 100,000. |
| (c) Causes listed are the leading causes of death registered in 2007 based on the WHO recommended tabulation of leading causes. |
| (d) Excludes sequelae of suicide (Y87.0). Care needs to be taken in interpreting figures relating to suicide due to limitations in the data. |
| Source: ABS data available on request, 2007 Causes of Death. |
Causes of death
Ischaemic heart diseases (heart attack and related disorders) are the leading causes of death, followed by cerebrovascular disease for both males and females (table 11.5). Gender differences are apparent among other leading causes.
11.6 LIFE EXPECTANCY AT BIRTH, OECD COUNTRIES (years) - 2006 |
|
| Female | Male |
|
| Australia | 83.5 | 78.7 |
| Austria | 82.7 | 77.1 |
| Belgium | 82.3 | 76.6 |
| Canada | 83.0 | 78.4 |
| Czech Republic | 79.9 | 73.5 |
| Denmark | 80.7 | 76.1 |
| Finland | 83.1 | 75.9 |
| France | 84.1 | 77.2 |
| Germany | 82.4 | 77.2 |
| Greece | 82.0 | 77.1 |
| Hungary | 77.4 | 69.0 |
| Iceland | 83.0 | 79.4 |
| Ireland | 82.2 | 77.4 |
| Italy | 84.2 | 78.5 |
| Japan | 85.8 | 79.0 |
| Korea | 82.4 | 75.7 |
| Luxembourg | 81.9 | 76.8 |
| Mexico | 77.2 | 72.4 |
| Netherlands | 81.9 | 77.6 |
| New Zealand | 82.2 | 78.0 |
| Norway | 82.9 | 78.2 |
| Poland | 79.6 | 70.9 |
| Portugal | 82.3 | 75.5 |
| Slovakia | 78.2 | 70.4 |
| Spain | 84.4 | 77.7 |
| Sweden | 82.9 | 78.7 |
| Switzerland | 84.2 | 79.2 |
| Turkey | 75.3 | 71.1 |
| United Kingdom | 81.7 | 77.3 |
| United States of America | 80.7 | 75.4 |
|
| Source: OECD Health Data 2009. |
Lung cancer is ranked third for males followed by chronic lower respiratory diseases; while for females, dementia and Alzheimer's disease is third and trachea and lung cancer fourth.
International comparisons
Australia's death rates from all causes are among the lowest in the world, consistent with Australia's relatively high life expectancy. Life expectancy at birth for males and females in selected countries are shown in table 11.6.
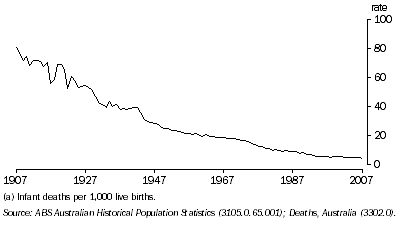
11.7 Infant mortality rates(a) 1907-2007
Infant mortality
In 2007, 1,179 infant deaths were registered in Australia. The infant mortality rate (IMR) is defined as the number of deaths of children under one year of age per 1,000 live births. The infant mortality rate of 4.1 infant deaths per 1,000 live births in 2007-08 was lower than the 2005-06 rate (4.9), and less than half that recorded in 1987 (8.7 deaths per 1,000 live births).
Australia's infant mortality has declined significantly in the last 100 years. In 1907, around one in 12 infants did not survive to their first birthday (IMR of 81.1 in 1907); in 2007, approximately one in 250 infants born did not survive their first year of life (IMR of 4.1) (graph 11.7).
The decline in infant mortality in the early 20th century has been linked to improvements in public sanitation, increased standard of living and health education and improvements in medical technology such as neonatal intensive care units.
 Print Page