EARNINGS
Statistics on earnings are used to help evaluate the standard of living of employees and to make policy decisions regarding income redistribution, social welfare, taxation and wage setting.
The ABS concept of earnings is based on the definition adopted by the twelfth International Conference of Labour Statisticians in 1973. Earnings refers to remuneration to employees for time worked or work done, as well as remuneration for time not worked (e.g. paid annual leave).
The ABS produces a range of statistics on earnings paid to employees. The quarterly Survey of Average Weekly Earnings (AWE) and the two-yearly Survey of Employee Earnings and Hours (EEH) provide a number of statistical measures of the remuneration paid to employees. The EEH survey also provides estimates of earnings for employees covered by each of the pay-setting methods (i.e. awards, collective agreements and individual arrangements). Information regarding pay-setting methods is available in the
Workplace relations section. The Survey of Employee Earnings, Benefits and Trade Union Membership, which is conducted each August as a supplement to the monthly LFS, also provides information about the earnings of employees.
The quarterly Labour Price Index (LPI) measures changes in wages and salaries, and other 'non-wage' components which contribute to the cost to employers of employing labour ( i.e. annual leave, superannuation, payroll tax and workers' compensation). Unlike earnings measures produced from the AWE and EEH surveys, the LPI is unaffected by changes in the quality or quantity of work performed, that is, it is unaffected by changes in the composition of the labour force, hours worked, or changes in characteristics of employees (e.g. work performance). The LPI consists of two components: a wage price index, published quarterly; and a non-wage price index, which is available for each financial year. Information regarding the LPI is available in the Prices chapter.
Level of earnings
Data on the level of earnings reflect the variations within different population groups, and across industries and occupations. Changes in the level of earnings are also of interest in reflecting the strength of labour demand and supply.
The AWE survey provides an estimate of the gross weekly earnings paid to employees by measuring earnings during a one-week reference period in the middle month of a quarter (excluding irregular payments not related to the reference period). Data are collected from the payroll records of a sample of employers.
The AWE survey provides three types of earnings measures. The first is average weekly ordinary time earnings (commonly referred to as AWOTE) for full-time adult employees, which relates to that part of total earnings attributable to award, standard or agreed hours of work. A second measure is full-time adult total earnings, which includes both ordinary time and overtime pay. A third measure is total earnings for all employees (including full-time and part-time, adult and junior).
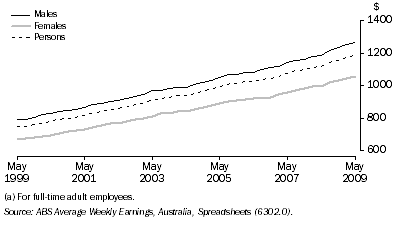
Graph 8.43 shows AWOTE from May 1999 to May 2009. Over the ten-year period, AWOTE for full-time adult male employees increased from $796 to $1,268 (or 59%), while for full-time adult female employees it increased from $668 to $1,054 (or 58%).
8.43 Average Weekly Ordinary Time Earnings(a)

In May 2009 the difference between male and female average weekly earnings was lowest for full-time adult AWOTE (where female earnings were 83% of the male figure of $1,268) and highest for all employee total earnings (where female earnings were 65% of the male figure of $1,110) (table 8.44). The latter difference reflects the inclusion of part-time employees (a higher proportion of female employees work part time) and the inclusion of overtime pay (of which men earn more than women). In May 2009, 44% of female employees worked part time compared with 16% of male employees.
8.44 AVERAGE WEEKLY EARNINGS - May 2009 |
|
 | Males | Females | Persons |
 | $ | $ | $ |
|
| Full-time adult ordinary time earnings | 1 267.7 | 1 053.7 | 1 187.8 |
| Full-time adult total earnings | 1 334.3 | 1 068.1 | 1 234.9 |
| All employees total earnings | 1 110.3 | 726.6 | 918.6 |
|
| Source: ABS Average Weekly Earnings, Australia (6302.0). |
Table 8.45 presents AWOTE for full-time adult men and women by states and territories in May 2009. The highest weekly earnings for men and women were in the Australian Capital Territory ($1,408 for men and $1,256 for women). The lowest weekly earnings were in Tasmania for both men ($1,037) and women ($934).
8.45 AVERAGE WEEKLY EARNINGS(a), By state and territory - May 2009 |
|
 | Males | Females | Persons |
 | $ | $ | $ |
|
| New South Wales | 1 280.1 | 1 085.4 | 1 206.5 |
| Victoria | 1 239.5 | 1 041.9 | 1 165.9 |
| Queensland | 1 241.4 | 1 004.6 | 1 152.9 |
| South Australia | 1 180.4 | 1 018.6 | 1 118.5 |
| Western Australia | 1 401.3 | 1 062.6 | 1 287.0 |
| Tasmania | 1 037.4 | 933.5 | 1 001.7 |
| Northern Territory | 1 247.5 | 1 037.2 | 1 150.9 |
| Australian Capital Territory | 1 407.7 | 1 256.3 | 1 340.3 |
| Australia | 1 267.7 | 1 053.7 | 1 187.8 |
|
| (a) Full-time adult ordinary time earnings. |
| Source: ABS Average Weekly Earnings, Australia (6302.0). |
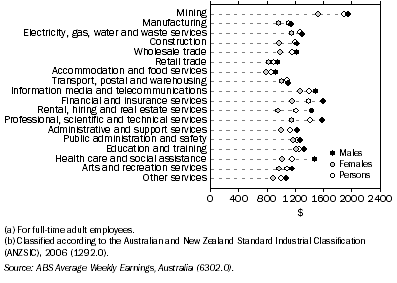
In May 2009, the Mining industry recorded the highest AWOTE for full-time adults ($1,950 for men and $1,528 for women) (graph 8.46). The industries with the lowest AWOTE for full-time adults were Accommodation and food services ($922 for men and $790 for women) and Retail trade ($950 and $822 respectively) .
AWOTE for full-time adult women was less than for men in all industries. The largest difference between the earnings of full-time adult males and females occurred in Rental, hiring and real estate services, with females earning 67% of males. The difference in earnings was smallest in Transport, postal and warehousing (the average earnings of full-time adult females were 92% of full-time adult males).
8.46 Average Weekly Ordinary Time Earnings(a), By industry(b)
- May 2009

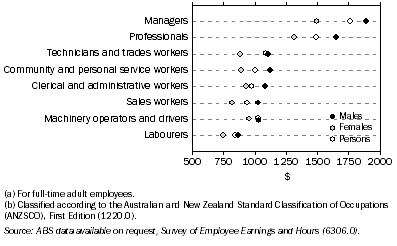
Data on earnings are also available from the EEH survey. This survey provides additional information on employee characteristics such as occupation. Average weekly ordinary time cash earnings (i.e. including amounts salary sacrificed) for full-time adult employees by occupation for August 2008 are shown in graph 8.47. For men and women, Labourers recorded the lowest average weekly ordinary time cash earnings of all the occupation groups ($866 for men and $747 for women). The occupation group with the highest weekly earnings was Managers ($1,886 for men and $1,494 for women).
Men had higher average weekly ordinary time cash earnings than women in each major occupation group. For full-time adult employees, the proportional difference between average weekly ordinary time cash earnings for men and women was smallest for Machinery operators and drivers (average earnings of women were 93% of those of men) and greatest for Managers and Community and personal service workers (both 79%).
8.47 AVERAGE WEEKLY ORDINARY TIME CASH EARNINGS(a), By occupation(b)
- ^August 2008

The Survey of Employee Earnings, Benefits and Trade Union Membership provides data on average weekly earnings across a range of socio-demographic characteristics.
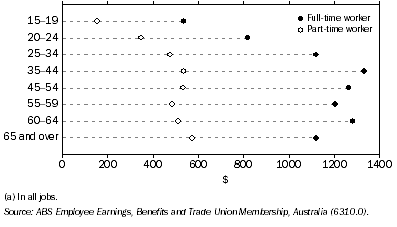
In August 2008, average weekly earnings of full-time workers was more than double that of part-time workers across all age groups. Full-time workers earned, on average, $1,163 per week in all jobs, compared with $428 for part-time workers. Workers with the lowest average weekly earnings were those aged 15-19 years ($536 for full-time workers and $154 for part-time workers) while those with the highest average weekly earnings were aged 35-44 years ($1,333 for full-time workers and $535 for part-time workers) (graph 8.48).
8.48 Average weekly earnings(a), By age group
- August 2008

 Print Page