HIGHER EDUCATION
Public and private providers of higher education that receive funding from the Australian Government include both self-accrediting and non-self-accrediting institutions. Self-accrediting providers, like universities are generally established under state and territory legislation, are autonomous bodies, and operate in accordance with the requirements for Australian Government funding.
Non-self-accrediting higher education providers are accredited by state and territory authorities. They are mainly private providers of varying sizes, and include theological colleges and other providers that offer courses in areas such as business, information technology, natural therapies, hospitality, health, law and accounting.
Higher education providers offer a range of undergraduate and post-graduate courses including traditional academic areas of learning and research, as well as more practical courses with a vocational orientation. Courses may vary in form, entry requirements, duration and method of assessment. For instance, courses can be full time or part time, delivered on-campus, by distance education, or a mix of these modes. In addition, some institutions offer courses which associate full-time study with periods of employment. Courses cover many disciplines such as the humanities, social sciences, education, environmental education, science, mathematics and computing, visual/performing arts, engineering and processing, health sciences, business, economics, law and agriculture.
Students and courses
In 2008, there were 1.1 million students enrolled in higher education courses, of whom 63% were aged less than 25 years and 55% were female (graph 12.18 and table 12.19).
12.18 HIGHER EDUCATION STUDENTS - 2008
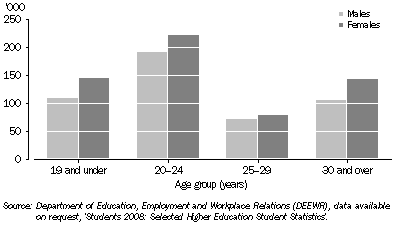
Table 12.19 shows a 4% increase in the number of higher education students from 2007 to 2008. Male student numbers increased by 3% (13,800 students), and females by 4% (22,449 students), between the two years. The number of students choosing multi-modal tuition, that is a mixture of face-to-face and external study, increased by 7% (4,899 students). Internal (on-campus) students increased by 4% (29,327 students). There was a 5% increase (an addition of 18,700) in full-time female students overall.
12.19 HIGHER EDUCATION STUDENTS, By mode and type of enrolment(a) |
|
 | | 2007
| | 2008
|
| | Males | Females | Persons | | Males | Females | Persons |
|
| Internal | | | | | | | |
| Full time | 291.2 | 332.1 | 623.3 | | 304.2 | 347.0 | 651.2 |
| Part time | 95.0 | 109.9 | 204.9 | | 94.9 | 111.4 | 206.3 |
| Total | 386.2 | 442.0 | 828.2 | | 399.2 | 458.4 | 857.5 |
| External | | | | | | | |
| Full time | 9.3 | 14.5 | 23.8 | | 9.2 | 15.6 | 24.8 |
| Part time | 43.0 | 63.5 | 106.5 | | 42.3 | 65.2 | 107.5 |
| Total | 52.3 | 78.0 | 130.3 | | 51.5 | 80.8 | 132.3 |
| Multi-modal | | | | | | | |
| Full time | 18.7 | 34.3 | 52.9 | | 20.2 | 37.0 | 57.2 |
| Part time | 6.3 | 12.1 | 18.5 | | 6.4 | 12.7 | 19.1 |
| Total | 25.0 | 46.4 | 71.4 | | 26.6 | 49.7 | 76.3 |
| Total | | | | | | | |
| Full time | 319.1 | 380.9 | 700.0 | | 333.6 | 399.6 | 733.2 |
| Part time | 144.3 | 185.5 | 329.8 | | 143.6 | 189.3 | 332.9 |
| Total | 463.5 | 566.4 | 1 029.8 | | 477.3 | 588.8 | 1 066.1 |
|
| (a) This relates to the delivery of education to the student. 'Internal' is where the delivery of education is done entirely within the institution, 'external' refers to delivery of course material to students off-campus, and 'multi-modal' is where at least one, but not all units, are provided at the institution. |
| Source: Department of Education, Employment and Workplace Relations (DEEWR), data available on request, 'Students: Selected Higher Education Statistics'. |
The basic undergraduate course at most institutions is a bachelor degree of three or four years duration. In 2008, 67% of higher education students were enrolled in bachelor degree courses. Most institutions also offer postgraduate level study ranging from one to two years of full-time study for a master's degree and three to five years for a doctoral degree. In 2008, 27% of higher education students were enrolled in postgraduate courses.
In 2008, higher education enrolments were most commonly in the fields of: Management and commerce; Society and culture; Health; and Education (table 12.20). These four fields accounted for 74% of all higher education course enrolments.
12.20 HIGHER EDUCATION STUDENTS, By level and field of education - 2008 |
|
| | Level of education of study
| |
| Field of education | Post-graduate
degree | Graduate
diploma/
Graduate
certificate | Bachelor
degree | Advanced
diploma/
Diploma | Other
education | Total courses |
|
| Natural and physical sciences | % | 6.1 | 3.0 | 8.6 | 1.2 | 0.4 | 7.3 |
| Information technology | % | 6.5 | 2.5 | 4.4 | 5.4 | 0.2 | 4.6 |
| Engineering and related technologies | % | 6.2 | 3.4 | 7.8 | 5.2 | 1.0 | 6.9 |
| Architecture and building | % | 2.1 | 1.6 | 2.6 | 0.8 | - | 2.3 |
| Agriculture, environment and related studies | % | 2.0 | 1.4 | 1.5 | 1.1 | 0.3 | 1.5 |
| Health | % | 9.5 | 15.1 | 15.1 | 3.6 | 0.6 | 13.2 |
| Education | % | 8.9 | 20.6 | 9.0 | 0.8 | 4.9 | 9.4 |
| Management and commerce | % | 38.2 | 23.6 | 28.1 | 60.4 | 2.6 | 29.8 |
| Society and culture | % | 17.3 | 25.7 | 23.0 | 9.7 | 10.4 | 21.3 |
| Creative arts | % | 3.4 | 3.4 | 8.2 | 9.1 | 2.6 | 6.7 |
| Food, hospitality and personal services | % | - | - | - | 2.8 | - | 0.1 |
| Mixed field programs | % | - | - | - | - | 12.5 | 0.4 |
| Non-award | % | - | - | - | - | 64.4 | 2.1 |
| All students(a) | no. | 215 692 | 73 566 | 716 776 | 25 393 | 34 668 | 1 066 095 |
|
| - nil or rounded to zero (including null cells) |
| (a) Students undertaking combined courses are counted in each field they are studying. Because of this, the sum of the field of education components may add to more than 100%. |
| Source: Department of Education, Employment and Workplace Relations (DEEWR), Selected Higher Education Statistics Staff 2008. |
Staff
Higher education staff may be classified as academic or non-academic. In 2008, there were more non-academic than academic staff. The most frequent classification of academic staff was at the lecturer level.
Table 12.21 shows a declining ratio of male to female higher education staff between 2003 and 2008. Males comprised 48% of all staff in 2003, but only 45% in 2008. Males outnumber females at and above senior lecturer levels of academic staff while females are higher at lecturer levels and below. In 2008, 58% of all academic staff were male, compared with 61% in 2003.
12.21 HIGHER EDUCATION STAFF(a) |
|
| | | MALES | FEMALES | PERSONS | PERSONS |
| Staff classification | % | % | % | 000 |
|
| 2003 | | | | |
| Academic staff | | | | |
| | Above senior lecturer | 80.9 | 19.1 | 100 | 7.8 |
| | Senior lecturer | 66.3 | 33.7 | 100 | 8.8 |
| | Lecturer | 53.6 | 46.4 | 100 | 12.3 |
| | Below lecturer | 46.8 | 53.2 | 100 | 7.0 |
| | Total | 61.3 | 38.7 | 100 | 35.9 |
| Non-academic staff | 37.8 | 62.2 | 100 | 48.6 |
| All staff | 47.8 | 52.2 | 100 | 84.4 |
| 2008 | | | | |
| Academic staff | | | | |
| | Above senior lecturer | 75.5 | 24.5 | 100 | 10.5 |
| | Senior lecturer | 60.9 | 39.1 | 100 | 10.2 |
| | Lecturer | 49.8 | 50.2 | 100 | 14.4 |
| | Below lecturer | 45.0 | 55.0 | 100 | 8.4 |
| | Total | 57.7 | 42.3 | 100 | 43.6 |
| Non-academic staff | 35.4 | 64.6 | 100 | 54.8 |
| All staff | 45.3 | 54.7 | 100 | 98.4 |
|
| (a) Includes full time and fractional full time staff. |
| Source: Department of Education, Employment and Workplace Relations (DEEWR), Selected Higher Education Statistics Staff 2008. |
 Print Page