NATIONAL ACCOUNTS
Introduction
Gross State Product
State Final Demand
Gross Household Disposable Income Per Capita
Introduction
National accounts are designed to provide a systematic summary of national economic activity and at the broad level, reflect key economic flows: production, the distribution of incomes, consumption, saving and investment.
State Accounts are essentially a dissection of the Australian Gross Domestic Product (GDP) estimate, contained in Australian System of National Accounts (cat. no. 5204.0). The state and territory equivalents of GDP are referred to as Gross State Product (GSP) and they are presented annually in Australian National Accounts: State Accounts (cat. no. 5220.0). State estimates of final demand (i.e. State Final Demand) are the only state data available quarterly, in Australian National Accounts: National Income, Expenditure and Product (cat. no. 5206.0).
Australia’s national accounts statistics are based on the latest international standard for national accounting - the System of National Accounts, 1993 (SNA93). Australia's application of these standards is described in Australian System of National Accounts: Concepts, Sources and Methods (cat. no. 5216.0).
While national estimates are based on the concepts and conventions embodied in SNA93, no such detailed standard is available for sub-national (regional/state) accounts. In the main, the national concepts are applicable to state accounts, but there remain a number of conceptual and measurement issues that either do not apply or are insignificant at the state/territory level. Most issues arise for the Transport and storage, Communication services, and Finance and insurance industries (because production often takes place across state borders) and in the treatment of central government. In such cases, conventions need to be established which reflect data availability and/or the needs of users.
The following information papers provide information on topical issues and recent developments relating to national and state accounts:
The information paper Gross State Product using the Production approach GSP(P) provides detailed information about the methods and sources for the compilation of Gross Value Added (GVA) by industry (including Ownership of dwellings and Taxes less subsidies on products) for each state/territory which was introduced in 2007. This paper should be used in conjunction with 5216.0 to gain an understanding of the concepts, sources and methods used to compile the state accounts.
Additional information can also be found on the National Accounts Theme Page, including upcoming releases and changes.
Gross State Product
GROSS STATE PRODUCT |
|  |
| Australian Capital Territory | |
| Current prices | Chain volume measures(a) | |
| $m | % change | $m | % change | |
| |
| 2002-03 | 16 323.0 | 9.8 | 19 485.0 | 3.5 | |
| 2003-04 | 17 579.0 | 7.7 | 19 785.0 | 1.5 | |
| 2004-05 | 18 615.0 | 5.9 | 20 236.0 | 2.3 | |
| 2005-06 | 19 815.0 | 6.4 | 20 983.0 | 3.7 | |
| 2006-07 | 21 734.0 | 9.7 | 21 734.0 | 3.6 | |
| 2007-08 | 23 365.0 | 7.5 | 22 287.0 | 2.5 | |
| |
| (a) Users are cautioned that these estimates are derived indirectly by calculating a deflator from the expenditure components. It is emphasised that, at times, there may be movements that cannot be fully explained in the chain volume estimates of GSP through the use of the proxy deflator (see paragraphs 30 to 34 of the Explanatory Notes of cat. no. 5220.0). Reference year for chain volume measures is 2006-07. |
| Source: Australian National Accounts: State Accounts (cat. no. 5220.0). |
Gross State Product (GSP) is the state/territory equivalent of GDP for Australia. It represents the total market value of goods and services produced within a state or territory within a given period, after deducting the cost of goods and services used up in the process of production, but before deducting allowances for the consumption of fixed capital.
In current prices, the Australian Capital Territory's (ACT) GSP was $23,365m in 2007-08, an increase of 7.5% over 2006-07. GSP increased by 2.5%, from $21,734m to $22,287m in chain volume terms over the same period. In comparison, Australia's GDP increased by 8.3% in current prices and 3.7% in chain volume terms between 2006-07 and 2007-08.
GROSS STATE/DOMESTIC PRODUCT, Per capita |
| |
| Australian Capital Territory | Australia | |
| Current prices | Chain volume measures(a) | Current prices | Chain volume measures(a) | |
| $ | % change | $ | % change | $ | % change | $ | % change | |
| |
| 2002-03 | 50 631.0 | 9.0 | 60 441.0 | 2.7 | 39 574.0 | 5.0 | 46 539.0 | 2.0 | |
| 2003-04 | 54 304.0 | 7.3 | 61 118.0 | 1.1 | 42 097.0 | 6.4 | 47 834.0 | 2.8 | |
| 2004-05 | 57 131.0 | 5.2 | 62 105.0 | 1.6 | 44 380.0 | 5.4 | 48 590.0 | 1.6 | |
| 2005-06 | 60 038.0 | 5.1 | 63 578.0 | 2.4 | 47 152.0 | 6.2 | 49 337.0 | 1.5 | |
| 2006-07 | 65 076.0 | 8.4 | 65 076.0 | 2.4 | 50 220.0 | 6.5 | 50 220.0 | 1.8 | |
| 2007-08 | 69 043.0 | 6.1 | 65 857.0 | 1.2 | 53 523.0 | 6.6 | 51 253.0 | 2.1 | |
| |
| (a) Users are cautioned that these estimates are derived indirectly by calculating a deflator from the expenditure components. It is emphasised that, at times, there may be movements that cannot be fully explained in the chain volume estimates of GSP through the use of the proxy deflator (see paragraphs 30 to 34 of the Explanatory Notes of cat. no. 5220.0). Reference year for chain volume measures is 2006-07. |
| Source: Australian National Accounts: State Accounts (cat. no. 5220.0). |
The ACT's GSP per capita was $69,043 in current prices in 2007-08, an increase of 6.1% over 2006-07 and 29.0% higher than GDP per capita for Australia ($53,523).
In chain volume terms, GSP for the ACT was $65,857 per capita in 2007-08, which was 1.2% higher than in 2006-07 ($65,076). GDP per capita for Australia was $51,253 in 2007-08, 2.1% higher than in 2006-07 ($50,220). GSP per capita for the ACT was 28.5% higher than Australia's GDP per capita in 2007-08 in chain volume terms.
INDUSTRY GROSS VALUE ADDED: Chain volume measures - 2007-08 |
| |
| Australian Capital Territory | Australia | |
| ANZSIC 1993 | $m | $m | |
| |
| Agriculture, forestry and fishing | 16 | 25 085 | |
| Mining | 17 | 82 650 | |
| Manufacturing | 347 | 106 776 | |
| Electricity, gas and water | 493 | 21 904 | |
| Construction | 1 907 | 77 101 | |
| Wholesale trade | 318 | 49 013 | |
| Retail trade | 924 | 58 932 | |
| Accommodation, cafes and restaurants | 372 | 20 529 | |
| Transport and storage | 544 | 51 295 | |
| Communication services | 461 | 26 377 | |
| Finance and insurance | 767 | 80 270 | |
| Property and business services | 2 775 | 131 907 | |
| Government administration and defence | 6 434 | 40 708 | |
| Education | 1 089 | 43 681 | |
| Health and community services | 1 200 | 64 758 | |
| Cultural and recreational services | 515 | 16 120 | |
| Personal and other services | 539 | 19 848 | |
| Total all industries | 20 466 | 1 000 377 | |
| Dwellings owned by persons | 1 747 | 83 423 | |
| Taxes less subsidies on products | 1 603 | 84 805 | |
| Statistical Discrepancy (P) | 218 | -1 026 | |
| Gross state/domestic product | 22 287 | 1 084 156 | |
| |
| Source: Australian National Accounts: State Accounts (cat. no. 5220.0). |
Industry Gross Value Added, Contributions to growth
: Chain volume measures
- 2007-08
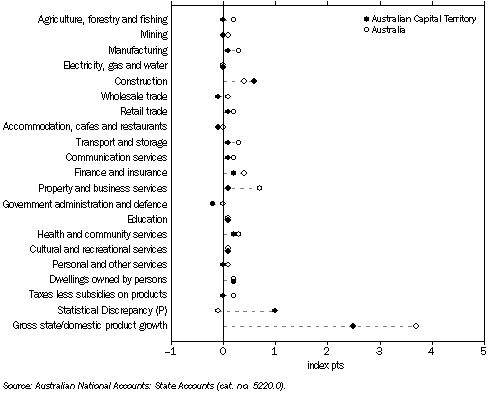
GVA is the value of output at basic prices minus the value of intermediate consumption at purchasers' prices. The term is used to describe gross product by industry. State GVA in current prices is not directly compiled so the Australian GVA by industry is allocated to the states using factor income shares. GVA is compiled in volume terms; for most industries an output indicator approach is used to create the chain volume measures of GVA by industry for each of the states and territories.
In chain volume terms,
Construction contributed the most to the growth of the ACT's GSP in 2007-08, with 0.6 percentage points (24.0%) of the 2.5% annual growth. Australia's largest contributor to the 3.7% growth in GDP was
Property and business services, at 0.7 percentage points (18.9%).
State Final Demand
STATE/DOMESTIC FINAL DEMAND |
| |
| Australian Capital Territory | Australia | |
| Current prices | Chain volume measures(a) | Current prices | Chain volume measures(a) | |
| $m | % change | $m | % change | $m | % change | $m | % change | |
| |
| 2002-03 | 25 469.0 | 12.6 | 29 401.0 | 8.7 | 796 200.0 | 8.4 | 876 868.0 | 5.9 | |
| 2003-04 | 27 159.0 | 6.6 | 30 554.0 | 3.9 | 856 818.0 | 7.6 | 928 276.0 | 5.9 | |
| 2004-05 | 29 455.0 | 8.5 | 32 009.0 | 4.8 | 915 266.0 | 6.8 | 972 418.0 | 4.8 | |
| 2005-06 | 31 902.0 | 8.3 | 33 597.0 | 5.0 | 981 360.0 | 7.2 | 1 012 854.0 | 4.2 | |
| 2006-07 | 37 093.0 | 16.3 | 37 093.0 | 10.4 | 1 055 786.0 | 7.6 | 1 055 785.0 | 4.2 | |
| 2007-08 | 39 255.0 | 5.8 | 37 898.0 | 2.2 | 1 146 974.0 | 8.6 | 1 111 254.0 | 5.3 | |
| |
| (a) Reference year for chain volume measures is 2006-07. |
| Source: Australian National Accounts: State Accounts (cat. no. 5220.0). |
State Final Demand (SFD) for the individual states and territories is conceptually equivalent to Domestic Final Demand (DFD) for Australia. It is the aggregate obtained by summing government final consumption expenditure, household final consumption expenditure, private gross fixed capital formation and the gross fixed capital formation of public corporations and general government.
In chain volume terms, SFD for the ACT was nearly $38b in 2007-08, an increase of 2.2% over 2006-07. Nationally, there was a 5.3% increase in DFD.
In current price terms, SFD for the ACT was $39b in 2007-08, an increase of 5.8% over 2006-07. DFD for Australia increased by 8.6% over the same period.
COMPONENTS OF FINAL DEMAND: Current prices - 2007-08 |
| |
| | Australian Capital Territory | Australia | |
| | $m | $m | |
| |
| Final consumption expenditure | | | |
| General government | 21 056 | 200 129 | |
| Households | 12 264 | 626 793 | |
| Gross fixed capital formation | | | |
| Machinery and equipment | 624 | 86 171 | |
| Non-dwelling construction | 1 386 | 77 674 | |
| Livestock | - | 2 400 | |
| Intangible fixed assets | 286 | 16 246 | |
| Dwellings | 933 | 68 174 | |
| Ownership transfer costs | 384 | 19 187 | |
| Private | 3 613 | 269 851 | |
| Public | 2 322 | 50 201 | |
| State final demand | 39 255 | - | |
| Domestic final demand | - | 1 146 974 | |
| |
| - nil or rounded to zero (including null cells) |
| Source: Australian National Accounts: State Accounts (cat. no. 5220.0). |
COMPONENTS OF FINAL DEMAND, Percentage share
: Current prices
- 2007-08
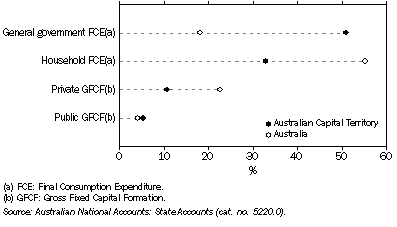
Final consumption expenditure is the net expenditure on goods and services by either public authorities (General government final consumption expenditure or GFCE) or persons and private non-profit institutions serving households (Household final consumption expenditure or HFCE). This is expenditure which does not result in the creation of fixed assets or inventories or in the acquisition of land and existing buildings or second-hand assets.
By contrast, gross fixed capital formation (GFCF) measures expenditure on fixed assets, and includes compensation of employees but not repair or maintenance of fixed assets. GFCF is divided into private and public corporations. By splitting final demand into these components, the structural differences between the ACT and Australia can be highlighted. Each of the components displayed in the table Components of Final Demand total to State Final Demand for ACT and Domestic Final Demand for Australia.
In current prices, GFCE represented 53.6% ($21b) of SFD in the ACT in 2007-08, compared to 17.4% of DFD nationally.
In contrast, HFCE represented 31.2% of the total final demand in the ACT, compared to 54.6% of Australia's DFD.
There was also a significant difference in expenditure on private GFCF. It was proportionately lower in the ACT than for Australia as a whole in 2007-08, accounting for 9.2% of SFD in the ACT versus 23.5% of DFD nationally.
FINAL CONSUMPTION EXPENDITURE, Australian Capital Territory
: Chain volume measures
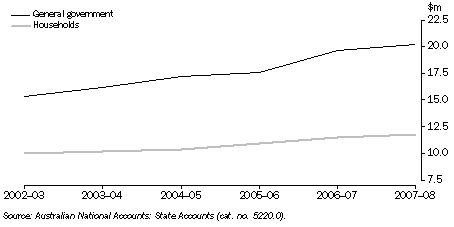
In chain volume terms, HFCE accounted for 36.9% of total final consumption expenditure in the ACT in 2007-08, with general government accounting for 63.1%. These proportions have remained relatively constant over time.
HOUSEHOLD FINAL CONSUMPTION EXPENDITURE: Current prices - 2007-08 |
| |
| Australian Capital Territory | Australia | |
| $m | $m | |
| |
| Food | 1 240 | 69 891 | |
| Alcoholic beverages and tobacco | 461 | 23 368 | |
| Clothing and footwear | 450 | 22 236 | |
| Rent and other dwelling services | 2 302 | 111 641 | |
| Electricity, gas and other fuel | 424 | 13 615 | |
| Furnishings and other household equipment | 822 | 33 786 | |
| Health | 463 | 34 166 | |
| Transport | 1 229 | 73 636 | |
| Communications | 313 | 16 714 | |
| Recreation and culture | 1 480 | 73 906 | |
| Education services | 389 | 21 380 | |
| Hotels, cafes and restaurants | 849 | 47 017 | |
| Miscellaneous goods and services | 1 965 | 85 435 | |
| Net expenditure interstate | -123 | - | |
| Total(a) | 12 264 | 626 793 | |
| |
| - nil or rounded to zero (including null cells) |
| (a) Total for Australia includes net expenditure overseas. |
| Source: Australian National Accounts: State Accounts (cat. no. 5220.0). |
HOUSEHOLD FINAL CONSUMPTION EXPENDITURE, Percentage share
: Current prices
- 2007-08
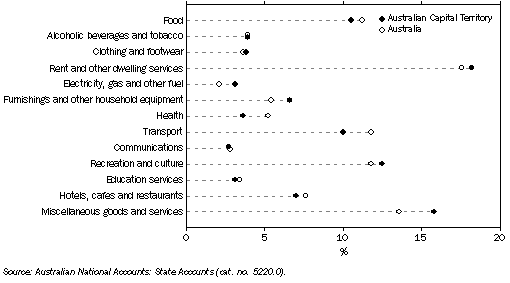
In 2007-08 those components of HFCE which took up the largest proportions of total expenditure were consistent between ACT households and households across Australia as a whole: Rent and other dwelling services was the single largest expenditure item (18.7% for the ACT and 17.8% for Australia), followed by
Miscellaneous goods and services (16.0% for the ACT versus 13.6% nationally), then
Recreation and culture (12.1% and 11.8% respectively).
Expenditure on
Communications took up the lowest proportion of HFCE for the ACT in 2007-08 (2.6%). For Australia it was
Electricity, gas and other fuel for Australia (2.2%).
GROSS FIXED CAPITAL FORMATION, ACT
- Chain volume measures
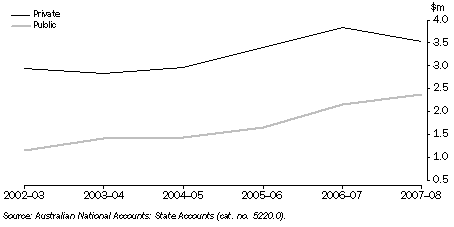
The ACT's expenditure on private fixed capital formation, in chain volume terms, was $3.5b in 2007-08, down 8.2% on the $3.8b spent in 2006-07.
Expenditure on public fixed capital formation, in chain volume terms, was $2.4b, up $221m (10.3%) on 2006-07.
TOTAL FACTOR INCOME: Current prices - 2007-08 |
| |
| Value | % change from previous year | |
| $m | % | |
Australian Capital Territory | |
| |
| Compensation of employees | 14 355 | 10.6 | |
| Gross operating surplus | 5 877 | 4.4 | |
| Gross mixed income | 1 196 | 2.0 | |
| Total factor income | 21 428 | 8.3 | |
Australia | |
| |
| Compensation of employees | 539 020 | 7.6 | |
| Gross operating surplus | 373 684 | 10.4 | |
| Gross mixed income | 97 495 | 4.7 | |
| Total factor income | 1 010 199 | 8.3 | |
| |
| Source: Australian National Accounts: State Accounts (cat. no. 5220.0). |
Total Factor Income (TFI) is that part of the cost of producing the GDP which consists of gross payments to factors of production, these payments being compensation of employees and gross operating surplus. TFI represents the value added by these factors in the process of production and is equivalent to gross state/domestic product less taxes plus subsidies on production, and imports.
TFI for the ACT grew by 8.3% ($1,651m) in the 2007-08 financial year, to $21,428m. This was in line with the national average growth of 8.3%.
Of the components of factor income, Compensation of employees recorded the strongest growth over the previous financial year, at 10.6% ($1,380m). In comparison, at the national level Gross operating surplus had the strongest growth with 10.4% - Compensation of employees grew by 7.6% and Gross mixed income by 4.7%.
Gross Household Disposable Income Per Capita
GROSS HOUSEHOLD DISPOSABLE INCOME PER CAPITA, By states and territories: Current prices |
| |
| 2007-08 | |
| $ | |
| |
| Australian Capital Territory | 52 389 | |
| New South Wales | 33 456 | |
| Victoria | 33 546 | |
| Queensland | 30 276 | |
| South Australia | 30 404 | |
| Western Australia | 34 091 | |
| Tasmania | 29 216 | |
| Northern Territory | 34 952 | |
| Australia | 32 898 | |
| |
| Source: Australian National Accounts: State Accounts (cat. no. 5220.0). |
Gross state product per capita does not measure income received by residents of a particular state or territory because a proportion of income generated in the production process may be transferred to other states/territories or overseas (and conversely income may be received from other states/territories or from overseas). A measure that takes these interstate or overseas flows into account is gross household disposable income per capita.
Households in the ACT recorded the highest level of gross household disposable income per capita of all states and territories in 2007-08, in current price terms. At $32,389 per capita, this was $17,437 more than the next highest juristiction, the Northern Territory ($34,980) and $19,491 higher than for Australia as a whole. Tasmania recorded the lowest gross household disposable income per capita in 2007-08 ($29,216).
Differences between states and territories are driven by a number of factors: average wage levels; proportion of the population in employment; the age distribution of the population and differences in the level of dwelling rent, including that imputed to owner occupiers. For example, one reason for the high level recorded for the ACT is the territory's high labour force participation rate - in June 2008 the trend participation rate for the ACT was 72.8%, versus 65.2% for Australia as a whole.