1301.0 - Year Book Australia, 2005  
ARCHIVED ISSUE Released at 11:30 AM (CANBERRA TIME) 21/01/2005   
   Page tools: Print Print Page  
Contents >> Construction >> Trends in construction activity

Construction activity is carried out by both private and public sectors. Over the past ten years, public sector construction has remained relatively constant, maintaining an annual value of work done of around $15,000m (graph 19.4). Private sector construction on the other hand has been more volatile. Private sector construction experienced a sharp decline in 2000-01 after the introduction of The New Tax System in July 2000. It exceeded 1999-2000 levels for the first time in 2002-03, and in 2003-04 increased by 9% to $61,144m.
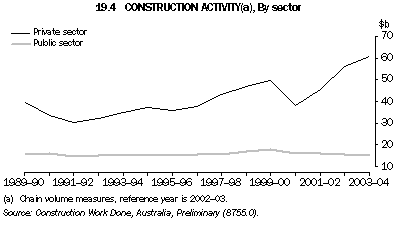
Graph 19.4: CONSTRUCTION ACTIVITY(a), By sector


Construction industry activity occurs in the three broad areas of activity - residential building, non-residential building, and engineering construction. The pattern of construction activity by area of activity has changed substantially over time (graph 19.5). Before 1991-92 the value of non-residential building activity was greater than engineering construction activity. However, since 1991-92, engineering construction activity has consistently exceeded non-residential building activity.

Graph 19.5 also shows the acceleration in residential building activity to record levels prior to the introduction of The New Tax System in July 2000 followed by a substantial downturn in 2000-01. Residential building and engineering construction surpassed 1999-2000 levels for the first time in 2002-03, with non-residential building surpassing these levels in 2003-04.

Graph 19.5: CONSTRUCTION ACTIVITY(a), By type of activity


Table 19.6 shows in 2003-04 residential building accounted for 44% of the value of total construction work done, engineering construction accounted for 35% and non-residential building accounted for 21%. In 2003-04 the value of total construction work done increased by 5% to $76,308m. Each of the three areas of activity exhibited an increase, with engineering construction recording the largest increase of 6.5%.


19.6 VALUE OF CONSTRUCTION WORK DONE(a), By type of activity

Residential building
Non-residential building
Engineering construction
Total construction(b)
$m
$m
$m
$m

1997-98
24,197
15,229
19,485
59,009
1998-99
26,219
15,980
21,459
63,759
1999-2000
30,596
15,590
21,571
67,515
2000-01
22,428
12,900
19,009
54,358
2001-02
27,480
13,582
20,610
61,670
2002-03
31,987
15,098
24,730
71,814
2003-04
33,951
16,031
26,326
76,308

(a) Chain volume measures, reference year is 2002-03.
(b) Chain volume measures for years other than 2002-03 and 2003-04 are not additive.

Source: Construction Work Done, Australia, Preliminary (8755.0).


Previous PageNext Page